Atmospheric composition and climate/Description: Difference between revisions
Jump to navigation
Jump to search
m (Text replace - "Hydrological cycle" to "Water") |
m (Text replace - "Natural vegetation and carbon cycle" to "Carbon cycle and natural vegetation") |
||
| Line 2: | Line 2: | ||
|Reference=Forster et al., 2007; WMO/UNEP, 2013; | |Reference=Forster et al., 2007; WMO/UNEP, 2013; | ||
|Description====Atmospheric gas concentrations=== | |Description====Atmospheric gas concentrations=== | ||
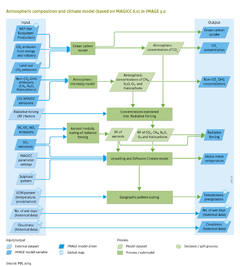
The IMAGE climate model calculates atmospheric CO2 concentration based on CO2 emission data for energy, industry and land-use change ([[Emissions]]); terrestrial carbon balance ([[ | The IMAGE climate model calculates atmospheric CO2 concentration based on CO2 emission data for energy, industry and land-use change ([[Emissions]]); terrestrial carbon balance ([[Carbon cycle and natural vegetation]]); and carbon uptake by the oceans (calculated in [[MAGICC model|MAGICC]] on the basis of the [[Bern Ocean Carbon model]]). | ||
Concentrations of other long-lived greenhouse gases (CH4, N2O, and halocarbons), and ozone (O3) precursors (CO, NMV OC) are calculated by MAGICC in a simple atmospheric chemistry module. Halocarbons and N2O concentrations mostly show a simple mass-concentration conversion and half-life behaviour. CH4 and ozone dynamics are more complex, with CH4 lifetime depending on the OH concentration level, and O3 and OH concentration levels depending on CH4, NOx, CO and NMVOC emissions ([[Meinshausen et al., 2011b]]). | Concentrations of other long-lived greenhouse gases (CH4, N2O, and halocarbons), and ozone (O3) precursors (CO, NMV OC) are calculated by MAGICC in a simple atmospheric chemistry module. Halocarbons and N2O concentrations mostly show a simple mass-concentration conversion and half-life behaviour. CH4 and ozone dynamics are more complex, with CH4 lifetime depending on the OH concentration level, and O3 and OH concentration levels depending on CH4, NOx, CO and NMVOC emissions ([[Meinshausen et al., 2011b]]). | ||
| Line 18: | Line 18: | ||
===Downscaling=== | ===Downscaling=== | ||
The global mean temperature change from MAGICC, and maps of temperature and precipitation change are used in a pattern scaling, to derive spatially explicit temperature and precipitation changes at one-year time steps to be used in other IMAGE modules (on [[ | The global mean temperature change from MAGICC, and maps of temperature and precipitation change are used in a pattern scaling, to derive spatially explicit temperature and precipitation changes at one-year time steps to be used in other IMAGE modules (on [[Carbon cycle and natural vegetation]], [[Crop and grass]], [[Water]], [[Nutrient balances]]). | ||
Grid-specific temperature and precipitation changes at the end of the century (2071–2100 compared to 1961–1990) from AR4 [[AOGCM model]] results (Ref database) are linearly interpolated based on the MAGGICs global mean temperature change at a certain time step, and the global mean temperature change corresponding to this map. For future calculations, the results of AR5 should be used to update the MAGICC parameterisation for all available AOGCMs, and to update the gridded patterns of climate change. | Grid-specific temperature and precipitation changes at the end of the century (2071–2100 compared to 1961–1990) from AR4 [[AOGCM model]] results (Ref database) are linearly interpolated based on the MAGGICs global mean temperature change at a certain time step, and the global mean temperature change corresponding to this map. For future calculations, the results of AR5 should be used to update the MAGICC parameterisation for all available AOGCMs, and to update the gridded patterns of climate change. | ||
}} | }} | ||
Revision as of 08:05, 17 May 2014
Parts of Atmospheric composition and climate/Description
| Component is implemented in: |
|
| Related IMAGE components |
| Projects/Applications |
| Models/Databases |
| Key publications |
| References |