Help
Uploads by Oostenrijr
Jump to navigation
Jump to search
This special page shows all uploaded files.
File list
Items per page:
20
50
100
250
500
Username:
Include old versions of files
Go
First page
Previous page
Next page
Last page
Date
Name
Thumbnail
Size
Description
Versions
17:52, 29 May 2017
Weighting factors for temperature precipitation land use and slope digraph QueryResult dot.png
(
file
)
9 KB
generated by the GraphViz
extension
from the
Weighting factors for temperature, precipitation, land use and slope
page
1
17:52, 29 May 2017
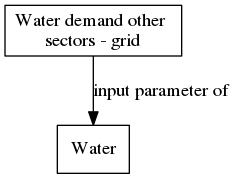
Water demand other sectors grid digraph QueryResult dot.png
(
file
)
6 KB
generated by the GraphViz
extension
from the
Water demand other sectors - grid
page
1
17:51, 29 May 2017
Water temperature grid digraph QueryResult dot.png
(
file
)
7 KB
generated by the GraphViz
extension
from the
Water temperature - grid
page
1
17:51, 29 May 2017
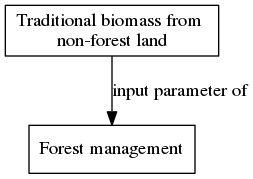
Traditional biomass from non forest land digraph QueryResult dot.png
(
file
)
7 KB
generated by the GraphViz
extension
from the
Traditional biomass from non-forest land
page
1
17:51, 29 May 2017
Topography elevation grid digraph QueryResult dot.png
(
file
)
6 KB
generated by the GraphViz
extension
from the
Topography, elevation - grid
page
1
17:51, 29 May 2017
Topography grid digraph QueryResult dot.png
(
file
)
6 KB
generated by the GraphViz
extension
from the
Topography - grid
page
1
17:51, 29 May 2017
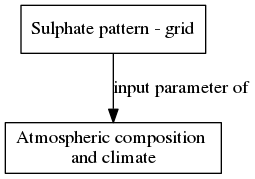
Sulphate pattern grid digraph QueryResult dot.png
(
file
)
7 KB
generated by the GraphViz
extension
from the
Sulphate pattern - grid
page
1
17:51, 29 May 2017
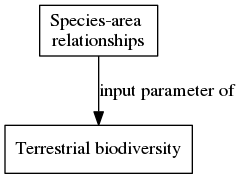
Species area relationships digraph QueryResult dot.png
(
file
)
7 KB
generated by the GraphViz
extension
from the
Species-area relationships
page
1
17:50, 29 May 2017
Presence of natural pest control grid digraph QueryResult dot.png
(
file
)
6 KB
generated by the GraphViz
extension
from the
Presence of natural pest control - grid
page
1
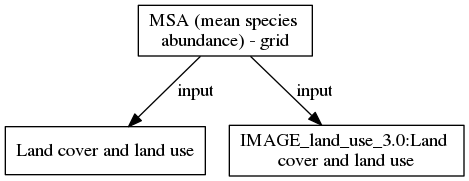
17:49, 29 May 2017
MSA mean species abundance grid digraph QueryResult dot.png
(
file
)
12 KB
generated by the GraphViz
extension
from the
MSA (mean species abundance) - grid
page
1
17:49, 29 May 2017
Intensive grassland area digraph QueryResult dot.png
(
file
)
10 KB
generated by the GraphViz
extension
from the
Intensive grassland area
page
1
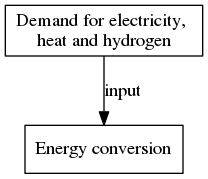
17:49, 29 May 2017
Demand for electricity heat and hydrogen digraph QueryResult dot.png
(
file
)
6 KB
generated by the GraphViz
extension
from the
Demand for electricity, heat and hydrogen
page
1
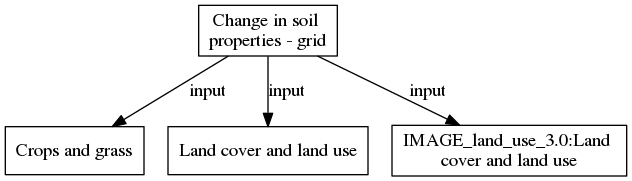
17:49, 29 May 2017
Change in soil properties grid digraph QueryResult dot.png
(
file
)
14 KB
generated by the GraphViz
extension
from the
Change in soil properties - grid
page
1
17:47, 29 May 2017
Soil types and profiles S World digraph QueryResult dot.png
(
file
)
8 KB
generated by the GraphViz
extension
from the
Soil types and profiles (S-World)
page
1
17:47, 29 May 2017
Soil properties grid digraph QueryResult dot.png
(
file
)
13 KB
generated by the GraphViz
extension
from the
Soil properties - grid
page
1
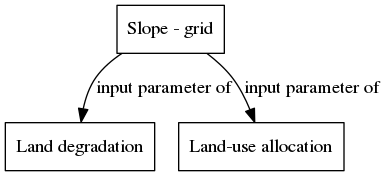
17:47, 29 May 2017
Slope grid digraph QueryResult dot.png
(
file
)
9 KB
generated by the GraphViz
extension
from the
Slope - grid
page
1
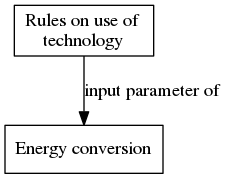
17:47, 29 May 2017
Rules on use of technology digraph QueryResult dot.png
(
file
)
7 KB
generated by the GraphViz
extension
from the
Rules on use of technology
page
1
17:47, 29 May 2017
Road map grid digraph QueryResult dot.png
(
file
)
6 KB
generated by the GraphViz
extension
from the
Road-map - grid
page
1
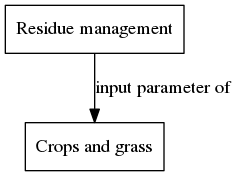
17:47, 29 May 2017
Residue management digraph QueryResult dot.png
(
file
)
6 KB
generated by the GraphViz
extension
from the
Residue management
page
1
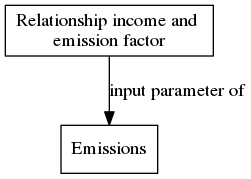
17:47, 29 May 2017
Relationship income and emission factor digraph QueryResult dot.png
(
file
)
6 KB
generated by the GraphViz
extension
from the
Relationship income and emission factor
page
1
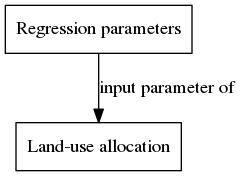
17:47, 29 May 2017
Regression parameters digraph QueryResult dot.png
(
file
)
6 KB
generated by the GraphViz
extension
from the
Regression parameters
page
1
17:47, 29 May 2017
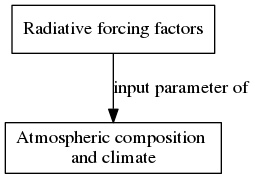
Radiative forcing factors digraph QueryResult dot.png
(
file
)
8 KB
generated by the GraphViz
extension
from the
Radiative forcing factors
page
1
17:47, 29 May 2017
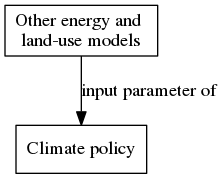
Other energy and land use models digraph QueryResult dot.png
(
file
)
7 KB
generated by the GraphViz
extension
from the
Other energy and land-use models
page
1
17:47, 29 May 2017
Other crops digraph QueryResult dot.png
(
file
)
6 KB
generated by the GraphViz
extension
from the
Other crops
page
1
17:47, 29 May 2017
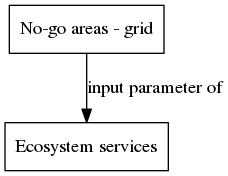
No go areas grid digraph QueryResult dot.png
(
file
)
6 KB
generated by the GraphViz
extension
from the
No-go areas - grid
page
1
17:47, 29 May 2017
Nitrogen critical load digraph QueryResult dot.png
(
file
)
7 KB
generated by the GraphViz
extension
from the
Nitrogen critical load
page
1
17:47, 29 May 2017
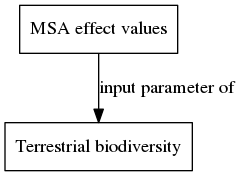
MSA effect values digraph QueryResult dot.png
(
file
)
7 KB
generated by the GraphViz
extension
from the
MSA effect values
page
1
17:47, 29 May 2017
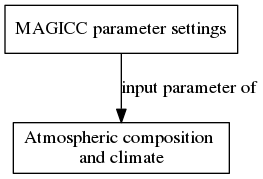
MAGICC parameter settings digraph QueryResult dot.png
(
file
)
8 KB
generated by the GraphViz
extension
from the
MAGICC parameter settings
page
1
17:47, 29 May 2017
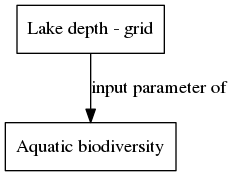
Lake depth grid digraph QueryResult dot.png
(
file
)
7 KB
generated by the GraphViz
extension
from the
Lake depth - grid
page
1
17:47, 29 May 2017
LOD location of dams and reservoirs digraph QueryResult dot.png
(
file
)
7 KB
generated by the GraphViz
extension
from the
LOD (location of dams and reservoirs)
page
1
17:47, 29 May 2017
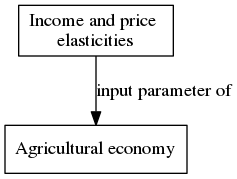
Income and price elasticities digraph QueryResult dot.png
(
file
)
7 KB
generated by the GraphViz
extension
from the
Income and price elasticities
page
1
17:46, 29 May 2017
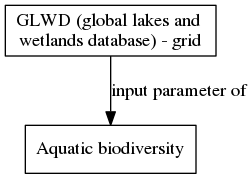
GLWD global lakes and wetlands database grid digraph QueryResult dot.png
(
file
)
9 KB
generated by the GraphViz
extension
from the
GLWD (global lakes and wetlands database) - grid
page
1
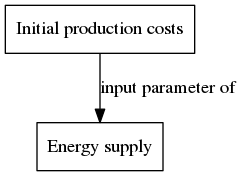
17:44, 29 May 2017
Initial production costs digraph QueryResult dot.png
(
file
)
6 KB
generated by the GraphViz
extension
from the
Initial production costs
page
1
17:44, 29 May 2017
Initial technology cost digraph QueryResult dot.png
(
file
)
6 KB
generated by the GraphViz
extension
from the
Initial technology cost
page
1
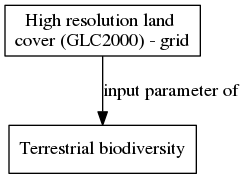
17:44, 29 May 2017
High resolution land cover GLC2000 grid digraph QueryResult dot.png
(
file
)
8 KB
generated by the GraphViz
extension
from the
High resolution land cover (GLC2000) - grid
page
1
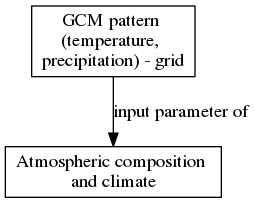
17:44, 29 May 2017
GCM pattern temperature precipitation grid digraph QueryResult dot.png
(
file
)
9 KB
generated by the GraphViz
extension
from the
GCM pattern (temperature, precipitation) - grid
page
1
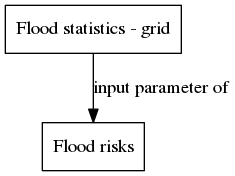
17:44, 29 May 2017
Flood statistics grid digraph QueryResult dot.png
(
file
)
6 KB
generated by the GraphViz
extension
from the
Flood statistics - grid
page
1
17:44, 29 May 2017
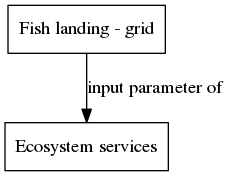
Fish landing grid digraph QueryResult dot.png
(
file
)
6 KB
generated by the GraphViz
extension
from the
Fish landing - grid
page
1
17:44, 29 May 2017
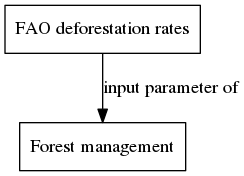
FAO deforestation rates digraph QueryResult dot.png
(
file
)
6 KB
generated by the GraphViz
extension
from the
FAO deforestation rates
page
1
17:43, 29 May 2017
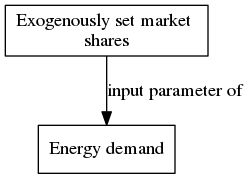
Exogenously set market shares digraph QueryResult dot.png
(
file
)
7 KB
generated by the GraphViz
extension
from the
Exogenously set market shares
page
1
17:43, 29 May 2017
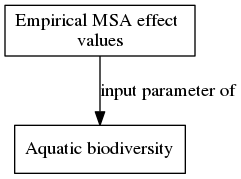
Empirical MSA effect values digraph QueryResult dot.png
(
file
)
8 KB
generated by the GraphViz
extension
from the
Empirical MSA effect values
page
1
17:43, 29 May 2017
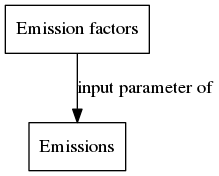
Emission factors digraph QueryResult dot.png
(
file
)
5 KB
generated by the GraphViz
extension
from the
Emission factors
page
1
17:43, 29 May 2017
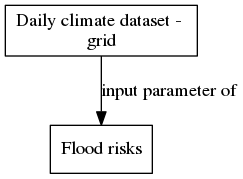
Daily climate dataset grid digraph QueryResult dot.png
(
file
)
6 KB
generated by the GraphViz
extension
from the
Daily climate dataset - grid
page
1
17:43, 29 May 2017
Digital water network grid digraph QueryResult dot.png
(
file
)
10 KB
generated by the GraphViz
extension
from the
Digital water network - grid
page
1
17:43, 29 May 2017
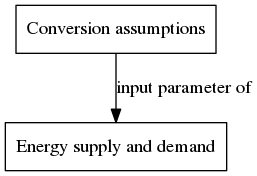
Conversion assumptions digraph QueryResult dot.png
(
file
)
7 KB
generated by the GraphViz
extension
from the
Conversion assumptions
page
1
17:43, 29 May 2017
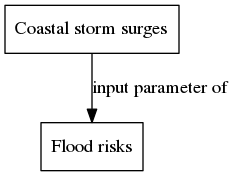
Coastal storm surges digraph QueryResult dot.png
(
file
)
6 KB
generated by the GraphViz
extension
from the
Coastal storm surges
page
1
17:43, 29 May 2017
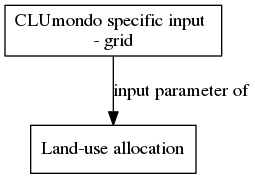
CLUmondo specific input grid digraph QueryResult dot.png
(
file
)
7 KB
generated by the GraphViz
extension
from the
CLUmondo specific input - grid
page
1
17:43, 29 May 2017
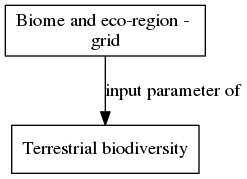
Biome and eco region grid digraph QueryResult dot.png
(
file
)
7 KB
generated by the GraphViz
extension
from the
Biome and eco-region - grid
page
1
17:43, 29 May 2017
Accessibility grid digraph QueryResult dot.png
(
file
)
10 KB
generated by the GraphViz
extension
from the
Accessibility - grid
page
1
17:42, 29 May 2017
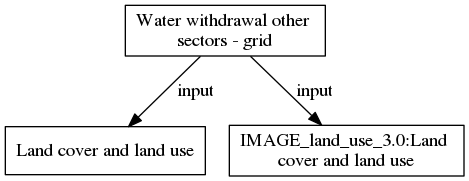
Water withdrawal other sectors grid digraph QueryResult dot.png
(
file
)
11 KB
generated by the GraphViz
extension
from the
Water withdrawal other sectors - grid
page
1
First page
Previous page
Next page
Last page
Navigation menu
Personal tools
Log in
Namespaces
Special page
English
Views
More
Search
Home IMAGE
Home IMAGE
IMAGE framework
Framework introduction
Framework summary
Model components
Applications
Publications
Big Flowchart
Versions
Navigation
Via key policy issues
Via policy interventions
Via components
Via variables
Via graphical dataflow
Via references
All overviews
Browse wiki
Browse categories
All overviews
Glossary
IMAGE-model data
Download overview
Download packages
USS manual
About
Colophon
Contact
Site changes
Tools
User contributions
Logs
View user groups
Special pages
Printable version


