Climate policy/Policy issues: Difference between revisions
Jump to navigation
Jump to search
No edit summary |
No edit summary |
||
| Line 34: | Line 34: | ||
As shown in the figure below, all reductions result from reduced emissions from deforestation (REDD). The contributions from {{abbrTemplate|REDD}} projects (about 560 MtCO2) are expected to exceed or match the required total reduction in all greenhouse gas emissions of 470 and 570 Mt CO2eq for the 36% and 39% reduction pledge scenarios. | As shown in the figure below, all reductions result from reduced emissions from deforestation (REDD). The contributions from {{abbrTemplate|REDD}} projects (about 560 MtCO2) are expected to exceed or match the required total reduction in all greenhouse gas emissions of 470 and 570 Mt CO2eq for the 36% and 39% reduction pledge scenarios. | ||
|Example=<div class=“version changev31”> | |Example=<div class=“version changev31”> | ||
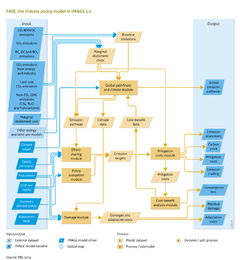
The Global Pathfinder module FAIR-SiMCaP was used to determine what the pledges for 2020 and the {{abbrTemplate|INDC}} targets (mainly for 2030) imply for global emission pathways consistent with meeting the 2 °C target ([[Van Vliet et al., 2012]], [[UNEP (2016)]], [[Den Elzen et al., 2016]];). The main findings were as follows (see also the figure below): | The Global Pathfinder module FAIR-SiMCaP was used to determine what the pledges for 2020 and the {{abbrTemplate|INDC}} targets (mainly for 2030) imply for global emission pathways consistent with meeting the 2 °C target ([[Van Vliet et al., 2012]], [[UNEP (2016)]], [[Den Elzen et al., 2016]];). The main findings were as follows (see also the figure below): | ||
* The global 2020 emission level resulting from implementation of the Copenhagen Accord pledges exceeds those of least-cost pathways that achieve a 2 °C target; | |||
* Slightly postponing mitigation action compared to the least-cost scenario seems technically feasible but at higher cumulative discounted mitigation costs; | |||
*Despite the reductions from the {{abbrTemplate|INDC}}s, the global and G20 emission level is still projected to be higher in 2030 than it was in 2010. | |||
*The 2030 emissions are expected to reach 54 to 56 gigatonnes of carbon dioxide equivalent – far above the level of 42 needed to have a chance of limiting global warming to 2 degrees Celsius this century. | |||
</div> | </div> | ||
* For an even longer delay (the current Copenhagen scenario), the FAIR-SiMCaP model cannot fully compensate the higher emission level in the short term; | * For an even longer delay (the current Copenhagen scenario), the FAIR-SiMCaP model cannot fully compensate the higher emission level in the short term; | ||
* A delay in emission reductions limits the flexibility in the portfolio of emission reduction options. Such delayed scenarios rely more on the use of bioenergy with carbon capture and storage ({{abbrTemplate|BECCS}}), an option with uncertain prospects for large-scale implementation. | * A delay in emission reductions limits the flexibility in the portfolio of emission reduction options. Such delayed scenarios rely more on the use of bioenergy with carbon capture and storage ({{abbrTemplate|BECCS}}), an option with uncertain prospects for large-scale implementation. | ||
}} | }} | ||
Revision as of 20:40, 6 November 2016
Parts of Climate policy/Policy issues