Emissions/Description: Difference between revisions
Jump to navigation
Jump to search
No edit summary |
No edit summary |
||
| Line 1: | Line 1: | ||
{{ComponentDescriptionTemplate | {{ComponentDescriptionTemplate | ||
|Reference=IPCC, 2006; Cofala et al., 2002; Stern, 2003; Smith et al., 2005; Van Ruijven et al., 2008; Carson, 2010; Smith et al., 2011; Bouwman et al., 1993; Harnisch et al., 2009; Velders et al., 2009; Kreileman and Bouwman, 1994; Bouwman et al., 1997; Bouwman et al., 2002a; Braspenning Radu et al., 2012; | |Reference=IPCC, 2006; Cofala et al., 2002; Stern, 2003; Smith et al., 2005; Van Ruijven et al., 2008; Carson, 2010; Smith et al., 2011; Bouwman et al., 1993; Harnisch et al., 2009; Velders et al., 2009; Kreileman and Bouwman, 1994; Bouwman et al., 1997; Bouwman et al., 2002a; Braspenning Radu et al., 2012; | ||
|Description===General approaches== | |Description===General approaches== | ||
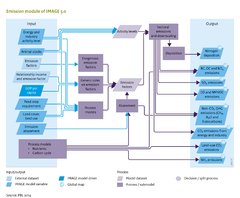
[[Table 5.1]] lists the different sources of emissions included in the IMAGE model. Emissions that are transported in water (nitrate, phosphorus) are discussed in [[Nutrient balances]]. Regarding the approach and spatial detail for modeling gaseous emissions, IMAGE uses four different ways to represent emissions. | [[Table 5.1]] lists the different sources of emissions included in the IMAGE model. Emissions that are transported in water (nitrate, phosphorus) are discussed in [[Nutrient balances]]. Regarding the approach and spatial detail for modeling gaseous emissions, IMAGE uses four different ways to represent emissions. | ||
| Line 41: | Line 41: | ||
* Cement and steel production. For these commodities, IMAGE-TIMER actually includes detailed demand models ([[Energy supply and demand]]). Similar to energy, the emissions are calculated by multiplying the activity levels to exogenously set emission factors. | * Cement and steel production. For these commodities, IMAGE-TIMER actually includes detailed demand models ([[Energy supply and demand]]). Similar to energy, the emissions are calculated by multiplying the activity levels to exogenously set emission factors. | ||
* Other industrial activities. Here the activity levels are formulated as a regional function of industrial value added. Activity levels include for instance copper production, and the production of solvents. Again, emissions are calculated by multiplying the activity levels with emission factors. | * Other industrial activities. Here the activity levels are formulated as a regional function of industrial value added. Activity levels include for instance copper production, and the production of solvents. Again, emissions are calculated by multiplying the activity levels with emission factors. | ||
* For the halogenated gases, finally we have implemented the approach developed by [[Harnisch et al.,2009]]. They derived relationships with income for the main uses of halogenated gasses (HFCs, PFCs, SF6). In the actual use of the model, slightly updated parameters are used to better represent the projections as presented by [[Velders et al., 2009]]. The marginal abatement cost curve per gas still follows the methodology described by [[Harnisch et al., 2009]]. | * For the halogenated gases, finally we have implemented the approach developed by [[Harnisch et al., 2009]]. They derived relationships with income for the main uses of halogenated gasses (HFCs, PFCs, SF6). In the actual use of the model, slightly updated parameters are used to better represent the projections as presented by [[Velders et al., 2009]]. The marginal abatement cost curve per gas still follows the methodology described by [[Harnisch et al., 2009]]. | ||
==Land-use related emissions== | ==Land-use related emissions== | ||
The CO2 exchange between terrestrial ecosystems and the atmosphere computed by the LPJ model is described in [[Natural vegetation and carbon cycle]]. The land-use emissions model focuses on emissions of other important gases, including greenhouse gases (CH4, N2O), ozone precursors (NOx, CO, VOC), acidifying compounds (SO2, NH3) and aerosols (SO2, NO3, BC, OC). | The CO2 exchange between terrestrial ecosystems and the atmosphere computed by the LPJ model is described in [[Natural vegetation and carbon cycle]]. The land-use emissions model focuses on emissions of other important gases, including greenhouse gases (CH4, N2O), ozone precursors (NOx, CO, VOC), acidifying compounds (SO2, NH3) and aerosols (SO2, NO3, BC, OC). | ||
For many sources, the emission factor approach ([[equation 5.1]]) is used ([[Table 5.2]]). For anthropogenic sources, the emission factors are from the EDGAR database, with time-dependent values for historical years. During the scenario period, most emission factors are constant, except for explicit climate abatement policies (see below). However, there are some important exceptions. Atmospheric N emissions are modeled in a detailed way (see below), and in several other cases, the emission factor depends on the assumptions described in other parts of IMAGE. For example, CH4 emissions from nondairy and dairy cattle are calculated on the basis of the energy requirement and feed type (see [[Livestock | For many sources, the emission factor approach ([[equation 5.1]]) is used ([[Table 5.2]]). For anthropogenic sources, the emission factors are from the EDGAR database, with time-dependent values for historical years. During the scenario period, most emission factors are constant, except for explicit climate abatement policies (see below). However, there are some important exceptions. Atmospheric N emissions are modeled in a detailed way (see below), and in several other cases, the emission factor depends on the assumptions described in other parts of IMAGE. For example, CH4 emissions from nondairy and dairy cattle are calculated on the basis of the energy requirement and feed type (see [[Livestock]]). High-quality feed such as concentrates from feed crops have a lower CH4 emission factor than feeds with lower protein and higher contents of components with lower digestibility. This implies that when the feed conversion ratio changes, the CH4 emission will automatically change as well. Feed conversion ratios are prescribed, or are calculated on the basis of the animal productivity. | ||
Constant emission factors may lead to decreasing emissions per unit of product, for example when the emission factor is specified on a per head basis. An increasing production per head may then lead to a decreasing emission per unit of product. An example is the constant CH4 emission from animal waste per animal, which leads to decreasing emissions per unit of meat or milk when the production per animal increases. | Constant emission factors may lead to decreasing emissions per unit of product, for example when the emission factor is specified on a per head basis. An increasing production per head may then lead to a decreasing emission per unit of product. An example is the constant CH4 emission from animal waste per animal, which leads to decreasing emissions per unit of meat or milk when the production per animal increases. | ||
| Line 54: | Line 54: | ||
Land-use related emissions of NH3, N2O and NO are calculated with a grid-specific model, N2O from soils under natural vegetation is calculated with the model of [[Bouwman et al., 1993]]. This model is a regression model based on temperature, a proxy for soil carbon input, soil water and oxygen status and a proxy for net primary production. Ammonia emission from natural vegetation is based on net primary production, C:Nratio and an emission factor, and the model accounts for in-canopy retention of the emitted NH3 ([[Bouwman et al., 1997]]). | Land-use related emissions of NH3, N2O and NO are calculated with a grid-specific model, N2O from soils under natural vegetation is calculated with the model of [[Bouwman et al., 1993]]. This model is a regression model based on temperature, a proxy for soil carbon input, soil water and oxygen status and a proxy for net primary production. Ammonia emission from natural vegetation is based on net primary production, C:Nratio and an emission factor, and the model accounts for in-canopy retention of the emitted NH3 ([[Bouwman et al., 1997]]). | ||
For agricultural emissions of N2O, the most important determinant factors are N application rate, climate type, soil organic-C content, soil texture, drainage, soil pH, type of crop, and type of fertilizer; the most important controls on NO emission include the N application rate per fertilizer type and soil organic-C content and soil drainage. (for a detailed description, see [[Bouwman et al., | For agricultural emissions of N2O, the most important determinant factors are N application rate, climate type, soil organic-C content, soil texture, drainage, soil pH, type of crop, and type of fertilizer; the most important controls on NO emission include the N application rate per fertilizer type and soil organic-C content and soil drainage. (for a detailed description, see [[Bouwman et al., 2002a]]. Agricultural emissions of NH3 from fertilized cropland and grassland uses the factors type of crop, fertilizer application rate by type and application mode, temperature, soil pH, and CEC ([[Bouwman et al., 2002]]). | ||
It should be noted that for comparison with other models, IMAGE also inludes the N2O methodology for sources as proposed by IPCC ([[IPCC, 2006]]). This methodology represents only the anthropogenic increase. This emission cannot be compared with the above model approach, which calculates the total emission. | It should be noted that for comparison with other models, IMAGE also inludes the N2O methodology for sources as proposed by IPCC ([[IPCC, 2006]]). This methodology represents only the anthropogenic increase. This emission cannot be compared with the above model approach, which calculates the total emission. | ||
Revision as of 11:35, 15 January 2014
Parts of Emissions/Description
| Component is implemented in: |
Components:and
|
| Projects/Applications |
| Models/Databases |
| Key publications |
| References |
|