Emissions/Description: Difference between revisions
Jump to navigation
Jump to search
No edit summary |
No edit summary |
||
| Line 1: | Line 1: | ||
{{ComponentDescriptionTemplate | {{ComponentDescriptionTemplate | ||
|Reference=IPCC, 2006; Cofala et al., 2002; Stern, 2003; Smith et al., 2005; Van Ruijven et al., 2008; Carson, 2010; Smith et al., 2011; Bouwman et al., 1993 | |Reference=IPCC, 2006; Cofala et al., 2002; Stern, 2003; Smith et al., 2005; Van Ruijven et al., 2008; Carson, 2010; Smith et al., 2011; Bouwman et al., 1993; Velders et al., 2009; Kreileman and Bouwman, 1994; Bouwman et al., 1997; Bouwman et al., 2002a; | ||
|Description===General approaches== | |Description===General approaches== | ||
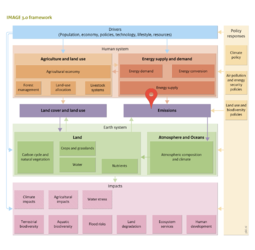
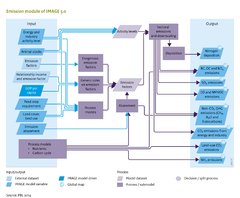
[[Table 5.1]] lists the different sources of emissions included in the IMAGE model. Emissions that are transported in water (nitrate, phosphorus) are discussed in [[Nutrient balances]]. Regarding the approach and spatial detail for modeling gaseous emissions, IMAGE uses four different ways to represent emissions. | [[Table 5.1]] lists the different sources of emissions included in the IMAGE model. Emissions that are transported in water (nitrate, phosphorus) are discussed in [[Nutrient balances]]. Regarding the approach and spatial detail for modeling gaseous emissions, IMAGE uses four different ways to represent emissions. | ||
Revision as of 13:49, 15 January 2014
Parts of Emissions/Description
| Component is implemented in: |
Components:and
|
| Projects/Applications |
| Models/Databases |
| Key publications |
| References |
|