Emissions/Description: Difference between revisions
Jump to navigation
Jump to search
No edit summary |
No edit summary |
||
| Line 3: | Line 3: | ||
|Description====General approaches=== | |Description====General approaches=== | ||
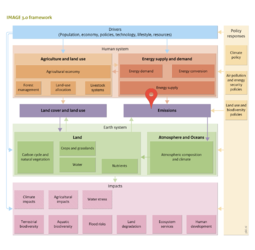
Air pollution emission sources included in IMAGE are listed in [[Emission table]], and emissions transported in water (nitrate, phosphorus) are discussed in [[Component Nutrients]]. In approach and spatial detail, gaseous emissions are represented in IMAGE in four ways: | Air pollution emission sources included in IMAGE are listed in [[Emission table]], and emissions transported in water (nitrate, phosphorus) are discussed in [[Component Nutrients]]. In approach and spatial detail, gaseous emissions are represented in IMAGE in four ways: | ||
1) ''World number (W)'' | |||
The simplest way to estimate emissions in IMAGE is to use global estimates from the literature. This approach is used for natural sources that cannot be modelled explicitly ([[Emission table]]). | |||
2) ''Emission factor (EF)'' | |||
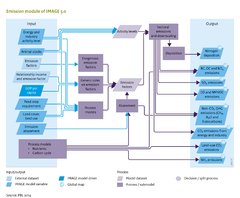
Past and future developments in anthropogenic emissions are estimated on the basis of projected changes in activity and emissions per unit of activity (Figure Flowchart). | |||
The equation for this emission factor approach is: | The equation for this emission factor approach is: | ||
::Emission = Activity<sub>r,i</sub> * EF-base<sub>r,i</sub> * AF <sub>r,i</sub> | |||
where: | where: | ||
* Emission is the emission of the specific gas or aerosol; | * Emission is the emission of the specific gas or aerosol; | ||
| Line 12: | Line 17: | ||
* i is the index for further specification (sector, energy carrier); | * i is the index for further specification (sector, energy carrier); | ||
* EF-base is the emission factor in the baseline; | * EF-base is the emission factor in the baseline; | ||
* AF is the abatement factor (reduction in the baseline emission factor as a result of climate policy). | * AF is the abatement factor (reduction in the baseline emission factor as a result of climate policy). | ||
The emission factors are time-dependent, representing changes in technology and air pollution control and climate mitigation policies. | The emission factors are time-dependent, representing changes in technology and air pollution control and climate mitigation policies. | ||
The emission factor is used to calculate energy and industry emissions, and agriculture, waste and land-use related emissions. Following Equation 5.2.1, there is a direct relationship between level of economic activity and emission level. Shifts in economic activity (e.g., use of natural gas instead of coal) may influence total emissions. Finally, emissions can change as a result of changes in emission factors (EF) and climate policy (AF). <br/> | |||
Some generic rules are used in describing changes in emissions over time (see further). The abatement factor (AF) is determined in the climate policy model FAIR (see Component [[Climate policy]]). The emission factor approach has some limitations, the most important of which is capturing the consequences of specific emission control technology (or management action) for multiple gas species, either synergies or trade-offs. | Some generic rules are used in describing changes in emissions over time (see further). The abatement factor (AF) is determined in the climate policy model FAIR (see Component [[Climate policy]]). The emission factor approach has some limitations, the most important of which is capturing the consequences of specific emission control technology (or management action) for multiple gas species, either synergies or trade-offs. | ||
3) ''Gridded emission factor with spatial distribution (GEF)'' | |||
GEF is a special case of the EF method, where a proxy distribution is used to present gridded emissions. This is done for a number of sources, such as emissions from livestock ([[Emission table]]). | |||
4) ''Gridded process model (GPM)'' | |||
Land-use related emissions of NH3, N2O and NO are calculated with grid-specific models (Figure 5.2.1). The models included in IMAGE are simple regression models that generate an emission factor (Figure 5.2.1). For comparison with other models, IMAGE also includes the N2O methodology generally proposed by IPCC (IPCC, 2006). | |||
The approaches used to calculate emissions from energy production and use, industrial processes and land-use related sources are discussed in more detail below. | The approaches used to calculate emissions from energy production and use, industrial processes and land-use related sources are discussed in more detail below. | ||
| Line 43: | Line 53: | ||
For N2O emissions from agriculture, the determining factors in IMAGE are N application rate, climate type, soil organic carbon content, soil texture, drainage, soil pH, crop type, and fertiliser type. The main factors used to calculate NO emissions include N application rate per fertiliser type, and soil organic carbon content and soil drainage (for detailed description, see Bouwman et al. (2002a)). For NH3 emissions from fertilised cropland and grassland, the factors used in IMAGE are crop type, fertiliser application rate per type and application mode, temperature, soil pH, and CEC (Bouwman et al., 2002a). | For N2O emissions from agriculture, the determining factors in IMAGE are N application rate, climate type, soil organic carbon content, soil texture, drainage, soil pH, crop type, and fertiliser type. The main factors used to calculate NO emissions include N application rate per fertiliser type, and soil organic carbon content and soil drainage (for detailed description, see Bouwman et al. (2002a)). For NH3 emissions from fertilised cropland and grassland, the factors used in IMAGE are crop type, fertiliser application rate per type and application mode, temperature, soil pH, and CEC (Bouwman et al., 2002a). | ||
For comparison with other models, IMAGE also includes the N2O methodology proposed by IPCC (2006). This methodology represents only anthropogenic emissions. For emissions from fertilizer fields this is the emission from a fertilized plot minus that from a control plot with zero fertilizer application. For this reason, soil emissions calculated with this methodology cannot be compared with the above model approaches, which yields total N2O emissions. | For comparison with other models, IMAGE also includes the N2O methodology proposed by IPCC (2006). This methodology represents only anthropogenic emissions. For emissions from fertilizer fields this is the emission from a fertilized plot minus that from a control plot with zero fertilizer application. For this reason, soil emissions calculated with this methodology cannot be compared with the above model approaches, which yields total N2O emissions. | ||
}} | }} | ||
Revision as of 08:50, 21 May 2014
Parts of Emissions/Description
| Component is implemented in: |
Components:and
|
| Projects/Applications |
| Models/Databases |
| Key publications |
| References |
|