Emissions/Description: Difference between revisions
Jump to navigation
Jump to search
No edit summary |
No edit summary |
||
| Line 1: | Line 1: | ||
{{ComponentDescriptionTemplate | {{ComponentDescriptionTemplate | ||
|Reference=IPCC, 2006; Cofala et al., 2002; Stern, 2003; Smith et al., 2005; Van Ruijven et al., 2008; Carson, 2010; Smith et al., 2011; Bouwman et al., 1993; Velders et al., 2009; Kreileman and Bouwman, 1994; Bouwman et al., 1997; Bouwman et al., 2002a; Velders et al., 2009; Harnisch et al., 2009; | |Reference=IPCC, 2006; Cofala et al., 2002; Stern, 2003; Smith et al., 2005; Van Ruijven et al., 2008; Carson, 2010; Smith et al., 2011; Bouwman et al., 1993; Velders et al., 2009; Kreileman and Bouwman, 1994; Bouwman et al., 1997; Bouwman et al., 2002a; Velders et al., 2009; Harnisch et al., 2009; | ||
|Description====General approaches=== | |Description====General approaches=== | ||
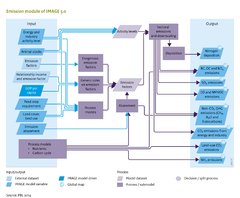
Air pollution emission sources included in IMAGE are listed in [[Emission table]], and emissions transported in water (nitrate, phosphorus) are discussed in Component [[Nutrients]]. In approach and spatial detail, gaseous emissions are represented in IMAGE in four ways: | Air pollution emission sources included in IMAGE are listed in [[Emission table]], and emissions transported in water (nitrate, phosphorus) are discussed in Component [[Nutrients]]. In approach and spatial detail, gaseous emissions are represented in IMAGE in four ways: | ||
| Line 74: | Line 74: | ||
For comparison with other models, IMAGE also includes the N2O methodology proposed by IPCC ([[IPCC, 2006|2006]]). This methodology represents only anthropogenic emissions. For emissions from fertilizer fields this is the emission from a fertilized plot minus that from a control plot with zero fertilizer application. For this reason, soil emissions calculated with this methodology cannot be compared with the above model approaches, which yields total N2O emissions. | For comparison with other models, IMAGE also includes the N2O methodology proposed by IPCC ([[IPCC, 2006|2006]]). This methodology represents only anthropogenic emissions. For emissions from fertilizer fields this is the emission from a fertilized plot minus that from a control plot with zero fertilizer application. For this reason, soil emissions calculated with this methodology cannot be compared with the above model approaches, which yields total N2O emissions. | ||
===Emission abatement=== | |||
Emissions from energy, industry, agriculture, waste and land-use sources are also expected to vary in future years, as a result of climate policy. This is described using abatement coefficients, the values of which depend on the scenario assumptions and the stringency of climate policy described in the climate policy component. In scenarios with climate change or sustainability as the key feature in the storyline, abatement is more important than in business-as-usual scenarios. Abatement factors are used for CH4 emissions from fossil fuel production and transport, N2O emissions from transport, CH4 emissions from enteric fermentation and animal waste, and N2O emissions from animal waste according to the IPCC method. These abatement files are calculated in the IMAGE climate policy sub-model FAIR (Component [[Climate policy]]) by comparing the costs of non-CO2 abatement in agriculture and other mitigation options. | |||
}} | }} | ||
Revision as of 13:39, 21 May 2014
Parts of Emissions/Description
| Component is implemented in: |
Components:and
|
| Projects/Applications |
| Models/Databases |
| Key publications |
| References |
|