Emissions/Description: Difference between revisions
Jump to navigation
Jump to search
Oostenrijr (talk | contribs) m (Text replace - "CO2 " to "CO<sub>2</sub>") |
Oostenrijr (talk | contribs) m (Text replace - "CO<sub>2</sub>" to "CO<sub>2</sub> ") |
||
| Line 47: | Line 47: | ||
* Combinations of the methods described above for a specific period, followed by additional rules based on income levels. | * Combinations of the methods described above for a specific period, followed by additional rules based on income levels. | ||
In IMAGE, {{abbrTemplate|EKC}} is used as an empirically observed trend, as it offers a coherent framework to describe overall trends in emissions in an Integrated Assessment context. However , it is accepted that many driving forces other than income influence future emissions. For instance, more densely populated regions are likely to have more stringent air quality standards. Moreover, technologies developed in high-income regions often tend to spread within a few years to developing regions. The generic equations in IMAGE can capture this by decreasing the threshold values over time. For CO<sub>2</sub>and other greenhouse gases, such as halogenated gases for which there is no evidence of {{abbrTemplate|EKC}} behaviour, IMAGE uses an explicit description of fuel use and deforestation. | In IMAGE, {{abbrTemplate|EKC}} is used as an empirically observed trend, as it offers a coherent framework to describe overall trends in emissions in an Integrated Assessment context. However , it is accepted that many driving forces other than income influence future emissions. For instance, more densely populated regions are likely to have more stringent air quality standards. Moreover, technologies developed in high-income regions often tend to spread within a few years to developing regions. The generic equations in IMAGE can capture this by decreasing the threshold values over time. For CO<sub>2</sub> and other greenhouse gases, such as halogenated gases for which there is no evidence of {{abbrTemplate|EKC}} behaviour, IMAGE uses an explicit description of fuel use and deforestation. | ||
The methodology for EKC scenario development applied in the energy model is based on two types of variables: income thresholds (2–3 steps); and gas- and sector-dependent reduction targets for these income levels. The income thresholds are set to historical points: the average {{abbrTemplate|OECD}} income at which air pollution control policies were introduced in these countries; and current income level in OECD countries. The model assumes that emission factors will start to decline in developing countries, when they reach the first income threshold, reflecting more efficient and cleaner technology. It also assumes that when developing countries reach the second income threshold, the emission factors will be equal to the average level in OECD regions. Beyond this income level, the model assumes further reductions, slowly converging to the minimum emission factor in OECD regions by 2030, according to projections made by {{abbrTemplate|IIASA}} under current legislation (current abatement plans). The IMAGE rules act at the level of regions, this could be seen as a limitation, but as international agreements lead countries to act as a group, this may not be an important limitation. | The methodology for EKC scenario development applied in the energy model is based on two types of variables: income thresholds (2–3 steps); and gas- and sector-dependent reduction targets for these income levels. The income thresholds are set to historical points: the average {{abbrTemplate|OECD}} income at which air pollution control policies were introduced in these countries; and current income level in OECD countries. The model assumes that emission factors will start to decline in developing countries, when they reach the first income threshold, reflecting more efficient and cleaner technology. It also assumes that when developing countries reach the second income threshold, the emission factors will be equal to the average level in OECD regions. Beyond this income level, the model assumes further reductions, slowly converging to the minimum emission factor in OECD regions by 2030, according to projections made by {{abbrTemplate|IIASA}} under current legislation (current abatement plans). The IMAGE rules act at the level of regions, this could be seen as a limitation, but as international agreements lead countries to act as a group, this may not be an important limitation. | ||
| Line 59: | Line 59: | ||
===Land-use related emissions=== | ===Land-use related emissions=== | ||
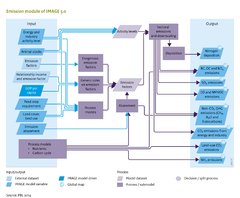
CO<sub>2</sub>exchanges between terrestrial ecosystems and the atmosphere computed by the LPJ model are described in [[Carbon cycle and natural vegetation]]. The land-use emissions model focuses on emissions of other compounds, including greenhouse gases (CH4, N2O), ozone precursors (NOx, CO, NMVOC), acidifying compounds (SO2, NH3) and aerosols (SO2, NO3, BC, OC). | CO<sub>2</sub> exchanges between terrestrial ecosystems and the atmosphere computed by the LPJ model are described in [[Carbon cycle and natural vegetation]]. The land-use emissions model focuses on emissions of other compounds, including greenhouse gases (CH4, N2O), ozone precursors (NOx, CO, NMVOC), acidifying compounds (SO2, NH3) and aerosols (SO2, NO3, BC, OC). | ||
For many sources, the emission factor ([[#General approaches|Equation 1]]) is used ([[Emission table]]). Most emission factors for anthropogenic sources are from the [[EDGAR database]], with time-dependent values for historical years. In the scenario period, most emission factors are constant, except for explicit climate abatement policies (see below). | For many sources, the emission factor ([[#General approaches|Equation 1]]) is used ([[Emission table]]). Most emission factors for anthropogenic sources are from the [[EDGAR database]], with time-dependent values for historical years. In the scenario period, most emission factors are constant, except for explicit climate abatement policies (see below). | ||
| Line 76: | Line 76: | ||
===Emission abatement=== | ===Emission abatement=== | ||
Emissions from energy, industry, agriculture, waste and land-use sources are also expected to vary in future years, as a result of climate policy. This is described using abatement coefficients, the values of which depend on the scenario assumptions and the stringency of climate policy described in the climate policy component. In scenarios with climate change or sustainability as the key feature in the storyline, abatement is more important than in business-as-usual scenarios. Abatement factors are used for CH4 emissions from fossil fuel production and transport, N2O emissions from transport, CH4 emissions from enteric fermentation and animal waste, and N2O emissions from animal waste according to the IPCC method. These abatement files are calculated in the IMAGE climate policy sub-model FAIR (Component [[Climate policy]]) by comparing the costs of non-CO<sub>2</sub>abatement in agriculture and other mitigation options. | Emissions from energy, industry, agriculture, waste and land-use sources are also expected to vary in future years, as a result of climate policy. This is described using abatement coefficients, the values of which depend on the scenario assumptions and the stringency of climate policy described in the climate policy component. In scenarios with climate change or sustainability as the key feature in the storyline, abatement is more important than in business-as-usual scenarios. Abatement factors are used for CH4 emissions from fossil fuel production and transport, N2O emissions from transport, CH4 emissions from enteric fermentation and animal waste, and N2O emissions from animal waste according to the IPCC method. These abatement files are calculated in the IMAGE climate policy sub-model FAIR (Component [[Climate policy]]) by comparing the costs of non-CO<sub>2</sub> abatement in agriculture and other mitigation options. | ||
}} | }} | ||
Revision as of 10:30, 1 July 2014
Parts of Emissions/Description
| Component is implemented in: |
Components:and
|
| Projects/Applications |
| Models/Databases |
| Key publications |
| References |
|