Energy conversion/Description: Difference between revisions
Jump to navigation
Jump to search
No edit summary |
No edit summary |
||
| Line 7: | Line 7: | ||
====Total demand for new capacity==== | ====Total demand for new capacity==== | ||
The electricity capacity required to meet the demand per region is based on a forecast of the maximum electricity demand plus a reserve margin of about 10% (including the capacity credit assigned to different forms of electricity generation). Maximum demand is calculated on the basis of an assumed monthly shape of the load duration curve (LDC) and the gross electricity demand. The latter comprises the net electricity demand from the end-use sectors plus electricity trade and transmission losses ( | The electricity capacity required to meet the demand per region is based on a forecast of the maximum electricity demand plus a reserve margin of about 10% (including the capacity credit assigned to different forms of electricity generation). Maximum demand is calculated on the basis of an assumed monthly shape of the load duration curve ({{AbbrTemplate|LDC}}) and the gross electricity demand. The latter comprises the net electricity demand from the end-use sectors plus electricity trade and transmission losses (LDC accounts for characteristics such as cooling and lighting demand). The demand for new generation capacity is the difference between the required and existing capacity. Power plants are assumed to be replaced at the end of their lifetime, which varies from 30 to 50 years, depending on the technology and is currently fixed in the model. | ||
====Decisions to invest in specific options ==== | ====Decisions to invest in specific options ==== | ||
In the | In the model, the decision to invest in generation technologies is based on the price of electricity (in {{AbbrTemplate|USD}}/{{AbbrTemplate|kWhe}}) produced per technology, using a multinomial logit equation that assigns larger market shares to the lower cost options. The specific cost of each option is broken down into several categories: investment or capital cost (USD/kWe); fuel cost (USD/GJ); operational and maintenance costs (O&M); and other costs (see further). The exception is hydropower capacity, which is exogenously prescribed, because large hydropower plants often have additional functions such as water supply and flood control. In the equations, some constraints are added to account for limitations in supply, for example restrictions on biomass availability. The investment for each option is given as the total investment in new generation capacity and the share of each individual technology determined on the basis of price and preference. | ||
====Operational strategy==== | ====Operational strategy==== | ||
| Line 20: | Line 20: | ||
====Fossil-fuel and bio-energy power plants==== | ====Fossil-fuel and bio-energy power plants==== | ||
A total of 20 types of power plants generating electricity using fossil fuels and bioenergy are included. These power plants represent different combinations of conventional technology, such as gasification and combined cycle (CC) technology; combined heat and power (CHP); and carbon capture and storage ({{AbbrTemplate|CCS}};[[Hendriks et al., 2004b|(2004b)]]). The specific capital costs and thermal efficiencies of these types of plants are determined by exogenous assumptions that describe the technological progress of typical components of these plants: | A total of 20 types of power plants generating electricity using fossil fuels and bioenergy are included. These power plants represent different combinations of conventional technology, such as gasification and combined cycle ({{AbbrTemplate|CC}}) technology; combined heat and power ({{AbbrTemplate|CHP}}); and carbon capture and storage ({{AbbrTemplate|CCS}};[[Hendriks et al., 2004b|(2004b)]]). The specific capital costs and thermal efficiencies of these types of plants are determined by exogenous assumptions that describe the technological progress of typical components of these plants: | ||
*For conventional power plants, the coal-fired plant is defined in terms of overall efficiency and investment cost. The characteristics of all other conventional plants (using oil, natural gas or bioenergy) are described in the investment differences for desulphurisation, fuel handling and efficiency. | |||
*For Combined Cycle (CC) power plants, the characteristics of a natural gas fired plant are set as the standard. Other CC plants (fuelled by oil, bioenergy and coal after gasification) are defined by indicating additional capital costs for gasification, efficiency losses due to gasification, and operation and maintenance (O&M) costs for fuel handling. | * For conventional power plants, the coal-fired plant is defined in terms of overall efficiency and investment cost. The characteristics of all other conventional plants (using oil, natural gas or bioenergy) are described in the investment differences for desulphurisation, fuel handling and efficiency. | ||
*Power plants with carbon-capture-and-storage systems (CCS) are assumed to be CC plants, but with fuel-specific lower efficiency and higher investment and O&M costs (related to capture and storage). | |||
*The characteristics of combined-heat-and-power plants (CHP) are similar to those of other plants, but with an assumed small increase in capital costs, in combination with a lower efficiency for electric conversion and an added factor for heat efficiency. | * For Combined Cycle (CC) power plants, the characteristics of a natural gas fired plant are set as the standard. Other CC plants (fuelled by oil, bioenergy and coal after gasification) are defined by indicating additional capital costs for gasification, efficiency losses due to gasification, and operation and maintenance (O&M) costs for fuel handling. | ||
* Power plants with carbon-capture-and-storage systems (CCS) are assumed to be CC plants, but with fuel-specific lower efficiency and higher investment and O&M costs (related to capture and storage). | |||
* The characteristics of combined-heat-and-power plants (CHP) are similar to those of other plants, but with an assumed small increase in capital costs, in combination with a lower efficiency for electric conversion and an added factor for heat efficiency. | |||
The cost of one unit electricity generated is equal to the sum of the capital cost, operational and maintenance costs (O&M), fuel cost, and CO2 storage cost. | The cost of one unit electricity generated is equal to the sum of the capital cost, operational and maintenance costs (O&M), fuel cost, and CO2 storage cost. | ||
===Solar and wind power=== | ====Solar and wind power==== | ||
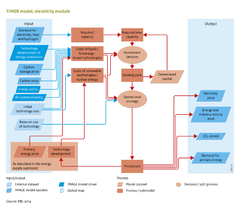
The costs of solar and wind power in the model are determined by learning and depletion dynamics. For renewable energy, costs relate to capital, O&M and system integration. The capital costs mostly relate to learning and depletion processes. Learning is represented by in learning curves (see flowchart); depletion is by long-term in cost–supply curves. | The costs of solar and wind power in the model are determined by learning and depletion dynamics. For renewable energy, costs relate to capital, O&M and system integration. The capital costs mostly relate to learning and depletion processes. Learning is represented by in learning curves (see flowchart); depletion is by long-term in cost–supply curves. | ||
| Line 40: | Line 44: | ||
The required spinning reserve of the power system is the capacity that can be used to respond to a rapid increase in demand. This is assumed to be 3.5% of the installed capacity of a conventional power plant. If wind and solar power further penetrate the market, the model assumes an additional, required spinning reserve of 15% of the intermittent capacity (after subtraction of the 3.5% existing capacity). The related costs are allocated to the intermittent source. | The required spinning reserve of the power system is the capacity that can be used to respond to a rapid increase in demand. This is assumed to be 3.5% of the installed capacity of a conventional power plant. If wind and solar power further penetrate the market, the model assumes an additional, required spinning reserve of 15% of the intermittent capacity (after subtraction of the 3.5% existing capacity). The related costs are allocated to the intermittent source. | ||
===Nuclear power=== | ====Nuclear power==== | ||
The costs of nuclear power also include capital, O&M and nuclear fuel costs. Similar to the renewable energy options, technology improvement in nuclear power is described via a learning curve (costs decrease with cumulative installed capacity). Fuel costs increase as a function of depletion. Fuel costs are determined on the basis of the estimated extraction costs for uranium and thorium resources, see [[Energy Supply]]. A small trade model for these fission fuels is included.. | The costs of nuclear power also include capital, O&M and nuclear fuel costs. Similar to the renewable energy options, technology improvement in nuclear power is described via a learning curve (costs decrease with cumulative installed capacity). Fuel costs increase as a function of depletion. Fuel costs are determined on the basis of the estimated extraction costs for uranium and thorium resources, see [[Energy Supply]]. A small trade model for these fission fuels is included.. | ||
==Hydrogen generation | ===Hydrogen generation=== | ||
The structure of the hydrogen generation submodule is similar to that for electric power generation ([[Van Ruijven et al., 2007]]) but with following differences: | The structure of the hydrogen generation submodule is similar to that for electric power generation ([[Van Ruijven et al., 2007]]) but with following differences: | ||
#There are only eleven supply options for hydrogen production: | #There are only eleven supply options for hydrogen production: | ||
Revision as of 14:40, 22 May 2014
Parts of Energy conversion/Description
| Component is implemented in: |
|
| Related IMAGE components |
| Projects/Applications |
| Models/Databases |
| Key publications |
| References |