Energy conversion/Description: Difference between revisions
Jump to navigation
Jump to search
No edit summary |
No edit summary |
||
| Line 1: | Line 1: | ||
{{ComponentDescriptionTemplate | {{ComponentDescriptionTemplate | ||
|Reference=Hoogwijk, 2004; Van Vuuren, 2007; Hendriks et al., 2004b; Van Ruijven et al., 2007; | |Reference=Hoogwijk, 2004; Van Vuuren, 2007; Hendriks et al., 2004b; Van Ruijven et al., 2007; | ||
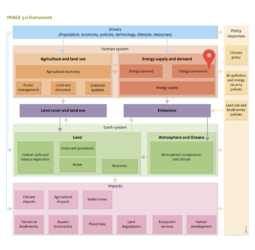
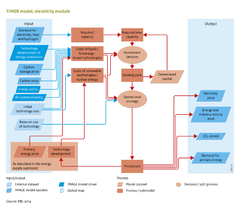
|Description= | |Description=[[TIMER model|TIMER]] includes two main energy conversion modules: Electric power generation and hydrogen generation. Below, electric power generation is described in detail. In addition, the key characteristics of the hydrogen generation model, which follows a similar structure, are presented. | ||
==Electric power generation== | |||
As shown in the flowchart, two key elements of the electric power generation are the investment strategy and the operational strategy in the sector. A challenge in simulating electricity production in an aggregated model is that in reality electricity production depends on a range of complex factors, related to costs, reliance, and the time required to switch on technologies. Modelling these factors requires a high level of detail and thus {{AbbrTemplate|IAM}}s such as [[TIMER model|TIMER]] concentrate on introducing a set of simplified, meta relationships ([[Hoogwijk, 2004]]; [[Van Vuuren, 2007]]). | |||
As shown in the flowdiagram, two key elements of the electric power generation model are the descriptions of the investment strategy and the operational strategy within the sector. A challenge of simulating electricity production in an aggregated model is that, in reality, electricity production depends on a whole range of complex factors, such as those related to costs, reliance, and the time it takes to switch on technologies. Modelling these factors requires a very high level of detail. Therefore, IAMs such as TIMER concentrate on introducing a set of simplified, meta relationships ([[Hoogwijk, 2004]]; [[Van Vuuren, 2007]]). | As shown in the flowdiagram, two key elements of the electric power generation model are the descriptions of the investment strategy and the operational strategy within the sector. A challenge of simulating electricity production in an aggregated model is that, in reality, electricity production depends on a whole range of complex factors, such as those related to costs, reliance, and the time it takes to switch on technologies. Modelling these factors requires a very high level of detail. Therefore, IAMs such as TIMER concentrate on introducing a set of simplified, meta relationships ([[Hoogwijk, 2004]]; [[Van Vuuren, 2007]]). | ||
==Total demand for new capacity | ===Total demand for new capacity=== | ||
The electricity capacity required to meet the demand per region is based on a forecast of the maximum electricity demand plus a reserve margin of about 10% (including the capacity credit assigned to different forms of electricity generation). Maximum demand is calculated on the basis of an assumed monthly shape of the load duration curve (LDC) and the gross electricity demand. The latter comprises the net electricity demand from the end-use sectors plus electricity trade and transmission losses (LDC accounts for characteristics such as cooling and lighting demand). The demand for new generation capacity is the difference between the required and existing capacity. Power plants are assumed to be replaced at the end of their lifetime, which varies from 30 to 50 years, depending on the technology and is currently fixed in the model. | |||
The required electricity capacity needed to meet the demand per region is based on a forecast of the maximum electricity demand plus a reserve margin of about 10%. The maximum demand is calculated on the basis of an assumed monthly shape of the load duration curve ([[HasAcronym::LDC]]) and the gross electricity demand. The latter comprises the net electricity demand (from the end-use sectors) plus electricity trade and transmission losses (the LDC accounts for characteristics such as cooling and lighting demand). The demand for new generation capacity equals the difference between the required and existing capacity. Here, power plants are assumed to be replaced at the end of their lifetime (depending on the technology, varying from 30 to 50 years, and currently fixed in the model). | The required electricity capacity needed to meet the demand per region is based on a forecast of the maximum electricity demand plus a reserve margin of about 10%. The maximum demand is calculated on the basis of an assumed monthly shape of the load duration curve ([[HasAcronym::LDC]]) and the gross electricity demand. The latter comprises the net electricity demand (from the end-use sectors) plus electricity trade and transmission losses (the LDC accounts for characteristics such as cooling and lighting demand). The demand for new generation capacity equals the difference between the required and existing capacity. Here, power plants are assumed to be replaced at the end of their lifetime (depending on the technology, varying from 30 to 50 years, and currently fixed in the model). | ||
Revision as of 17:24, 8 May 2014
Parts of Energy conversion/Description
| Component is implemented in: |
|
| Related IMAGE components |
| Projects/Applications |
| Models/Databases |
| Key publications |
| References |