Energy conversion/Description: Difference between revisions
Jump to navigation
Jump to search
No edit summary |
No edit summary |
||
| Line 14: | Line 14: | ||
====Total demand for new capacity==== | ====Total demand for new capacity==== | ||
<div class="version changev31"> | <div class="version changev31"> | ||
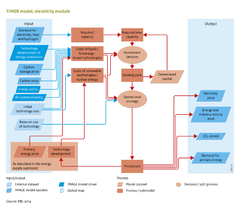
The electricity generation capacity required to meet the demand per region is based on a forecast of the maximum annual electricity demand plus a reserve margin. The reserve margin consists of a general reserve margin of 10-20% plus a compensation for imperfect capacity credits (the ability of capacity to supply peak | The electricity generation capacity required to meet the demand per region is based on a forecast of the maximum annual electricity demand plus a reserve margin. The reserve margin consists of a general reserve margin of 10-20% plus a compensation for imperfect capacity credits (the ability of capacity to supply peak load) of existing capacity. The maximum annual demand is calculated on the basis of an assumed shape of the load duration curve (LDC) and the gross electricity demand. The latter comprises the net electricity demand from the end-use sectors plus electricity trade and transmission losses. An LDC shows the distribution of load over a certain timespan in a downward form. The peak load is plotted to the left of the LDC and the lowest load is plotted to the right. The shape of the LDC is based on work by Ueckerdt et al. ([[Ueckerdt et al., 2016|2016]]), who derived regional normalized residual LDCs (RLDC) for different solar and wind shares, including the application of optimized electricity storage. | ||
The final demand for new generation capacity is equal to the difference between the required and existing capacity. Power plants are assumed to be replaced at the end of their lifetime, which varies from 25 to 80 years, depending on the technology. | The final demand for new generation capacity is equal to the difference between the required and existing capacity. Power plants are assumed to be replaced at the end of their lifetime, which varies from 25 to 80 years, depending on the technology. | ||
Revision as of 17:24, 9 November 2016
Parts of Energy conversion/Description
| Component is implemented in: |
|
| Related IMAGE components |
| Projects/Applications |
| Models/Databases |
| Key publications |
| References |