Nutrients/Description: Difference between revisions
Jump to navigation
Jump to search
No edit summary |
No edit summary |
||
| Line 8: | Line 8: | ||
where is human N emissions (kg per person per year), D is the fraction of the total population that is connected to public sewerage systems (no dimension), and R N is the overall removal of N through wastewater treatment (no dimension). Total P emissions to surface water are calculated in a similar way, but also include estimates of P emissions to surface water resulting from the use of P-based dishwasher and laundry detergents. Nutrient removal by wastewater treatment R is based on the relative contribution of four classes of treatment (none, primary, secondary and tertiary treatment). D (calculated from the fraction of households with improved sanitation) and R (by treatment class) are scenario variables. | where is human N emissions (kg per person per year), D is the fraction of the total population that is connected to public sewerage systems (no dimension), and R N is the overall removal of N through wastewater treatment (no dimension). Total P emissions to surface water are calculated in a similar way, but also include estimates of P emissions to surface water resulting from the use of P-based dishwasher and laundry detergents. Nutrient removal by wastewater treatment R is based on the relative contribution of four classes of treatment (none, primary, secondary and tertiary treatment). D (calculated from the fraction of households with improved sanitation) and R (by treatment class) are scenario variables. | ||
==B. Soil nutrient budget model== | ==B. Soil nutrient budget model== | ||
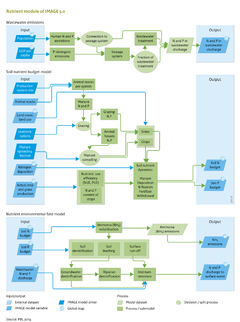
The soil budget approach ([[Bouwman et al., 2009]]; [[Bouwman et al., 2011]]) includes the N and P input and output for IMAGE grid cells. Soil N budgets are calculated for two production systems (see figure on the right, B.), i.e. mixed and pastoral livestock production systems ([[Livestock]]). N input includes application of synthetic N fertiliser (HasAcronym::Nfert) and animal manure (HasAcronym::Nman), biological N fixation (HasAcronym::Nfix), atmospheric N deposition (HasAcronym::Ndep). Output includes N withdrawal from the field through crop harvesting, hay and grass cutting, and grass consumed by grazing animals (HasAcronym::Nwithdr). The soil N budget (Nbudget) is calculated as follows: | The soil budget approach ([[Bouwman et al., 2009]]; [[Bouwman et al., 2011]]) includes the N and P input and output for IMAGE grid cells. Soil N budgets are calculated for two production systems (see figure on the right, B.), i.e. mixed and pastoral livestock production systems ([[Livestock]]). N input includes application of synthetic N fertiliser ([[HasAcronym::Nfert]]) and animal manure ([[HasAcronym::Nman]]), biological N fixation ([[HasAcronym::Nfix]]), atmospheric N deposition ([[HasAcronym::Ndep]]). Output includes N withdrawal from the field through crop harvesting, hay and grass cutting, and grass consumed by grazing animals ([[HasAcronym::Nwithdr]]). The soil N budget ([[HasAcronym::Nbudget]]) is calculated as follows: | ||
{{FormulaAndTableTemplate|Formula2_N}} | {{FormulaAndTableTemplate|Formula2_N}} | ||
For P the same approach is used, P input being animal manure and fertiliser. The soil nutrient budget ignores nutrient accumulation in soil organic matter in case of a positive budget (surplus), and soil organic matter decomposition and mineralisation. With no accumulation, a surplus represents a potential loss to the environment (for N this includes NH3 volatilisation ([[Emissions]]), denitrification, surface runoff and leaching; for P this is surface runoff). | For P the same approach is used, P input being animal manure and fertiliser. The soil nutrient budget ignores nutrient accumulation in soil organic matter in case of a positive budget (surplus), and soil organic matter decomposition and mineralisation. With no accumulation, a surplus represents a potential loss to the environment (for N this includes NH3 volatilisation ([[Emissions]]), denitrification, surface runoff and leaching; for P this is surface runoff). | ||
For a spatial allocation of the nutrient input to IMAGE grid cells, the crop groups in IMAGE (temperate cereals, rice, maize, tropical cereals, pulses, roots and tubers, oil crops, other crops, energy crops) and grass are aggregated to form five broad groups, including grass, wetland rice, leguminous crops, other upland crops and energy crops, within mixed and pastoral production systems. | For a spatial allocation of the nutrient input to IMAGE grid cells, the crop groups in IMAGE (temperate cereals, rice, maize, tropical cereals, pulses, roots and tubers, oil crops, other crops, energy crops) and grass are aggregated to form five broad groups, including grass, wetland rice, leguminous crops, other upland crops and energy crops, within mixed and pastoral production systems. | ||
===Fertiliser=== | ===Fertiliser=== | ||
Fertiliser use is based on fertiliser use efficiency, representing the production in kilograms of dry matter per kilogram of fertiliser N (HasAcronym::NUE) or P (HasAcronym::PUE). NUE and PUE vary between countries because of differences in crop mix, their attainable yield potential, soil quality, amount and form of N and P application and management. For constructing scenarios on fertiliser use, data on the 1970–2005 period serve as a guide to distinguish countries with an input exceeding crop uptake (positive budget or surplus) from countries with a deficit. Generally, farmers in countries with a surplus are assumed to be increasingly efficient in the use of fertilisers (increasing NUE and PUE). In countries with nutrient deficits, an increase in crop yields is only possible under an increase in the nutrient input; initially this will cause NUE and PUE to decrease, which shows a decrease in soil nutrient depletion due to increased fertiliser use. | Fertiliser use is based on fertiliser use efficiency, representing the production in kilograms of dry matter per kilogram of fertiliser N ([[HasAcronym::NUE]]) or P ([[HasAcronym::PUE]]). NUE and PUE vary between countries because of differences in crop mix, their attainable yield potential, soil quality, amount and form of N and P application and management. For constructing scenarios on fertiliser use, data on the 1970–2005 period serve as a guide to distinguish countries with an input exceeding crop uptake (positive budget or surplus) from countries with a deficit. Generally, farmers in countries with a surplus are assumed to be increasingly efficient in the use of fertilisers (increasing NUE and PUE). In countries with nutrient deficits, an increase in crop yields is only possible under an increase in the nutrient input; initially this will cause NUE and PUE to decrease, which shows a decrease in soil nutrient depletion due to increased fertiliser use. | ||
===Manure=== | ===Manure=== | ||
Total manure production is computed from animal stocks and N and P excretion rates (see figure on the right, B.). IMAGE uses constant N and P excretion rates per head, for dairy and non-dairy cattle, buffaloes, sheep and goats, pigs, poultry, horses, asses, mules and camels. Constant excretion rates imply that the N and P generation per unit of product decreases under increased milk and meat production per animal. | Total manure production is computed from animal stocks and N and P excretion rates (see figure on the right, B.). IMAGE uses constant N and P excretion rates per head, for dairy and non-dairy cattle, buffaloes, sheep and goats, pigs, poultry, horses, asses, mules and camels. Constant excretion rates imply that the N and P generation per unit of product decreases under increased milk and meat production per animal. | ||
N and P in the manure for each animal category are spatially allocated to mixed and pastoral systems. Within each country and system, the manure is distributed over three manure management systems: | N and P in the manure for each animal category are spatially allocated to mixed and pastoral systems. Within each country and system, the manure is distributed over three manure management systems: | ||
# grazing; | |||
# storage in animal housing and storage systems; | |||
# manure used outside the agricultural system as fuel or for other purposes. The amount of manure assigned to grazing is based on the fraction of grass in feed rations (see figure on the right, B.). | |||
Stored animal manure available for application to cropland and grassland includes all stored and collected manure, excluding ammonia volatilisation from animal houses and storage systems. IMAGE assumes that, in industrialised countries, 50% of the available animal manure from storage systems is applied to arable land and the remainder to grassland. In most developing countries, manure spreading on croplands is 95% of the available manure and 5% to grassland, thus accounting for the lower economic importance of grass compared to crops in developing countries. For EU countries, maximum manure application rates of 170 to 250 kilograms N per hectare are used, reflecting existing regulations. | Stored animal manure available for application to cropland and grassland includes all stored and collected manure, excluding ammonia volatilisation from animal houses and storage systems. IMAGE assumes that, in industrialised countries, 50% of the available animal manure from storage systems is applied to arable land and the remainder to grassland. In most developing countries, manure spreading on croplands is 95% of the available manure and 5% to grassland, thus accounting for the lower economic importance of grass compared to crops in developing countries. For EU countries, maximum manure application rates of 170 to 250 kilograms N per hectare are used, reflecting existing regulations. | ||
===Biological N2 fixation=== | ===Biological N2 fixation=== | ||
Revision as of 12:29, 16 December 2013
Parts of Nutrients/Description
| Component is implemented in: |
| Components: |
| Related IMAGE components |
| Projects/Applications |
| Key publications |
| References |