Nutrients/Description: Difference between revisions
Jump to navigation
Jump to search
No edit summary |
No edit summary |
||
| Line 17: | Line 17: | ||
For a spatial allocation of the nutrient input to IMAGE grid cells, the crop groups in IMAGE (temperate cereals, rice, maize, tropical cereals, pulses, roots and tubers, oil crops, other crops, energy crops) and grass are aggregated to form five broad groups, including grass, wetland rice, leguminous crops, other upland crops and energy crops, within mixed and pastoral production systems. | For a spatial allocation of the nutrient input to IMAGE grid cells, the crop groups in IMAGE (temperate cereals, rice, maize, tropical cereals, pulses, roots and tubers, oil crops, other crops, energy crops) and grass are aggregated to form five broad groups, including grass, wetland rice, leguminous crops, other upland crops and energy crops, within mixed and pastoral production systems. | ||
===Fertiliser=== | ===Fertiliser=== | ||
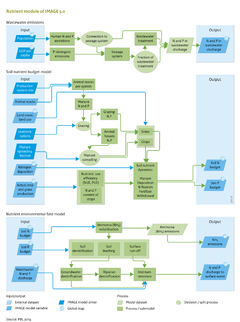
Fertiliser use is based on fertiliser use efficiency, representing the production in kilograms of dry matter per kilogram of fertiliser N ( | Fertiliser use is based on fertiliser use efficiency, representing the production in kilograms of dry matter per kilogram of fertiliser N (NUE) or P (PUE). NUE and PUE vary between countries because of differences in crop mix, their attainable yield potential, soil quality, amount and form of N and P application and management. For constructing scenarios on fertiliser use, data on the 1970–2005 period serve as a guide to distinguish countries with an input exceeding crop uptake (positive budget or surplus) from countries with a deficit. Generally, farmers in countries with a surplus are assumed to be increasingly efficient in the use of fertilisers (increasing NUE and PUE). In countries with nutrient deficits, an increase in crop yields is only possible under an increase in the nutrient input; initially this will cause NUE and PUE to decrease, which shows a decrease in soil nutrient depletion due to increased fertiliser use. | ||
===Manure=== | ===Manure=== | ||
Total manure production is computed from animal stocks and N and P excretion rates (see figure on the right, B.). IMAGE uses constant N and P excretion rates per head, for dairy and non-dairy cattle, buffaloes, sheep and goats, pigs, poultry, horses, asses, mules and camels. Constant excretion rates imply that the N and P generation per unit of product decreases under increased milk and meat production per animal. | Total manure production is computed from animal stocks and N and P excretion rates (see figure on the right, B.). IMAGE uses constant N and P excretion rates per head, for dairy and non-dairy cattle, buffaloes, sheep and goats, pigs, poultry, horses, asses, mules and camels. Constant excretion rates imply that the N and P generation per unit of product decreases under increased milk and meat production per animal. | ||
Revision as of 15:24, 17 December 2013
Parts of Nutrients/Description
| Component is implemented in: |
| Components: |
| Related IMAGE components |
| Projects/Applications |
| Key publications |
| References |