Nutrients/Description: Difference between revisions
Jump to navigation
Jump to search
m (Text replace - "Bouwman et al., 2011" to "Bouwman et al., 2013b") |
m (Text replace - "Bouwman et al., 2013" to "Bouwman et al., 2013a") |
||
| Line 1: | Line 1: | ||
{{ComponentDescriptionTemplate | {{ComponentDescriptionTemplate | ||
|Reference=Bouwman et al., 2009; Bouwman et al., | |Reference=Bouwman et al., 2009; Bouwman et al., 2013ab; Van Drecht et al., 2009; Cleveland et al., 1999; Bouwman et al., 2013a; | ||
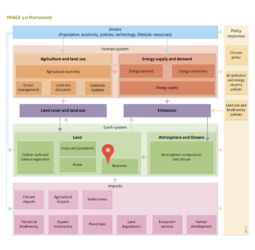
|Description=<h2> A. Wastewater</h2> | |Description=<h2> A. Wastewater</h2> | ||
Urban wastewater contains N and P emitted by households and industries that are connected to a sewerage system, and households with sanitation but without a sewerage connection. | Urban wastewater contains N and P emitted by households and industries that are connected to a sewerage system, and households with sanitation but without a sewerage connection. | ||
| Line 16: | Line 16: | ||
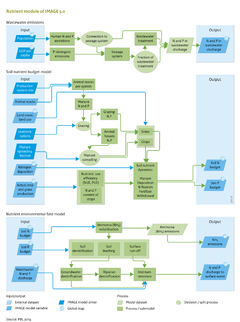
==B. Soil nutrient budget== | ==B. Soil nutrient budget== | ||
Soil nutrient budget | Soil nutrient budget | ||
The soil budget approach ([[Bouwman et al., 2009]]; [[Bouwman et al., | The soil budget approach ([[Bouwman et al., 2009]]; [[Bouwman et al., 2013ab]]) includes the N and P input and output for IMAGE grid cells. Soil N budgets are calculated for mixed and pastoral livestock production systems ([[Livestock]]). N input includes application of synthetic N fertiliser (Nfert) and animal manure (Nman), biological N fixation (Nfix), and atmospheric N deposition (Ndep). Output includes N withdrawal from the field through crop harvesting, hay and grass cutting, and grass consumed by grazing animals (Nwithdr). | ||
The soil N budget (Nbudget) is calculated as follows: | The soil N budget (Nbudget) is calculated as follows: | ||
| Line 35: | Line 35: | ||
===Biological N2 fixation=== | ===Biological N2 fixation=== | ||
Data on biological N2 fixation by leguminous crops (pulses and soybeans) are obtained from the N in the harvested product (see nutrient withdrawal). Thus any change in the rate of biological N2 fixation by legumes is the result of yield changes for pulses and soybeans. Apart from leguminous crops, IMAGE uses an annual rate of biological N2 fixation of 5 kilograms N per hectare for non-leguminous crops and grass, and 25 kilograms N per hectare for wetland rice. N fixation rates in natural ecosystems were based on the low estimates for areal coverage by legumes ([[Cleveland et al., 1999]]) as described by [[Bouwman et al., | Data on biological N2 fixation by leguminous crops (pulses and soybeans) are obtained from the N in the harvested product (see nutrient withdrawal). Thus any change in the rate of biological N2 fixation by legumes is the result of yield changes for pulses and soybeans. Apart from leguminous crops, IMAGE uses an annual rate of biological N2 fixation of 5 kilograms N per hectare for non-leguminous crops and grass, and 25 kilograms N per hectare for wetland rice. N fixation rates in natural ecosystems were based on the low estimates for areal coverage by legumes ([[Cleveland et al., 1999]]) as described by [[Bouwman et al., 2013a]]. | ||
===Atmospheric deposition=== | ===Atmospheric deposition=== | ||
Deposition rates for historical and future years are calculated by scaling N deposition field for the year 2000 (obtained from atmospheric chemistry transport models), using emission inventories for the historical period and N gas emissions in the scenario considered. IMAGE does not include atmospheric P deposition. | Deposition rates for historical and future years are calculated by scaling N deposition field for the year 2000 (obtained from atmospheric chemistry transport models), using emission inventories for the historical period and N gas emissions in the scenario considered. IMAGE does not include atmospheric P deposition. | ||
| Line 43: | Line 43: | ||
==C. Nutrient environmental fate== | ==C. Nutrient environmental fate== | ||
Nutrient losses from the plant-soil system to the soil-hydrological system are calculated from the nutrient budgets ([[Bouwman et al., | Nutrient losses from the plant-soil system to the soil-hydrological system are calculated from the nutrient budgets ([[Bouwman et al., 2013a]]). For N, the budget is corrected for ammonia volatilisation from grazing animals and from manure spreading ([[Emissions]]). Phosphorus not taken up by plants is generally bound to soil particles, with the only loss pathway being surface runoff. Nitrogen is more mobile and is transported via surface runoff and through soil, groundwater and riparian zones to surface water. | ||
===Soil denitrification=== | ===Soil denitrification=== | ||
Revision as of 15:31, 12 February 2014
Parts of Nutrients/Description
| Component is implemented in: |
| Components: |
| Related IMAGE components |
| Projects/Applications |
| Key publications |
| References |