Nutrients/Description: Difference between revisions
Jump to navigation
Jump to search
No edit summary |
No edit summary |
||
| Line 1: | Line 1: | ||
{{ComponentDescriptionTemplate | {{ComponentDescriptionTemplate | ||
|Reference=Bouwman et al., | |Reference=Bouwman et al., 2013c; Van Drecht et al., 2009; Cleveland et al., 1999; | ||
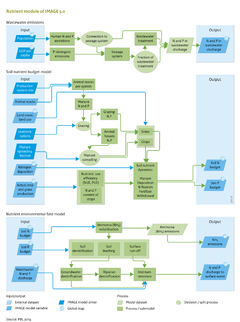
|Description====Wastewater=== | |Description====Wastewater=== | ||
Urban wastewater contains N and P emitted by households and industries that are connected to a sewerage system, and households with sanitation but without a sewerage connection. | Urban wastewater contains N and P emitted by households and industries that are connected to a sewerage system, and households with sanitation but without a sewerage connection. | ||
N discharges to surface water (''E<sub>sw</sub><sup>N</sup>'' in kg per person per year) are calculated as follows ([[Van Drecht et al., 2009]]; [[Morée et al., 2013]]): | N discharges to surface water (''E<sub>sw</sub><sup>N</sup>'' in kg per person per year) are calculated as follows ([[Van Drecht et al., 2009]]; [[Morée et al., 2013]]):{{FormulaAndTableTemplate|Formula1_N}}where: | ||
{{FormulaAndTableTemplate|Formula1_N}}where: | |||
*''E<sub>hum</sub><sup>N</sup>'' is human N emissions (kg per person per year), | *''E<sub>hum</sub><sup>N</sup>'' is human N emissions (kg per person per year), | ||
* D is the proportion of the total population connected to public sewerage systems (no dimension), | * D is the proportion of the total population connected to public sewerage systems (no dimension), | ||
*R N is the overall removal of N through wastewater treatment (no dimension). | *R N is the overall removal of N through wastewater treatment (no dimension). | ||
Total P emissions to surface water are calculated in a similar way, but also include estimates of P emissions to surface water resulting from the use of P-based dishwasher and laundry detergents. Nutrient removal by wastewater treatment R is based on the relative contribution of four classes of treatment (none, primary, secondary and tertiary treatment). D is calculated from the proportion of households with improved sanitation. D and R by treatment class are scenario variables. | Total P emissions to surface water are calculated in a similar way, but also include estimates of P emissions to surface water resulting from the use of P-based dishwasher and laundry detergents. Nutrient removal by wastewater treatment R is based on the relative contribution of four classes of treatment (none, primary, secondary and tertiary treatment). D is calculated from the proportion of households with improved sanitation. D and R by treatment class are scenario variables. | ||
The soil N budget (Nbudget) is calculated as follows: | ===Soil nutrient budget=== | ||
The soil budget approach ([[Bouwman et al., 2009]]; [[Bouwman et al., 2013c]]) considers all N and P inputs and outputs for IMAGE grid cells. N input terms in the budgets include application of synthetic N fertiliser (N<sub>fert</sub>) and animal manure (N<sub>man</sub>), biological N fixation (N<sub>fix</sub>), and atmospheric N deposition (N<sub>dep</sub>). Output terms include N withdrawal from the field through crop harvesting, hay and grass cutting, and grass consumed by grazing animals (N<sub>withdr</sub>). | |||
The soil N budget (Nbudget) is calculated as follows:{{FormulaAndTableTemplate|Formula2_N}} | |||
The same approach is used for P, with input terms being animal manure and fertiliser. The soil nutrient budget does not include nutrient accumulation in soil organic matter for a positive budget (surplus), or nutrient depletion due to soil organic matter decomposition and mineralisation. With no accumulation, a surplus represents a potential loss to the environment. For N this includes NH3 volatilisation (see Section 5.2), denitrification, surface runoff and leaching. For P, this is surface runoff. | The same approach is used for P, with input terms being animal manure and fertiliser. The soil nutrient budget does not include nutrient accumulation in soil organic matter for a positive budget (surplus), or nutrient depletion due to soil organic matter decomposition and mineralisation. With no accumulation, a surplus represents a potential loss to the environment. For N this includes NH3 volatilisation (see Section 5.2), denitrification, surface runoff and leaching. For P, this is surface runoff. | ||
For spatial allocation of the nutrient input to IMAGE grid cells, grass and the crop groups in IMAGE (temperate cereals, rice, maize, tropical cereals, pulses, roots and tubers, oil crops, other crops, energy crops) and grass are aggregated to five broad groups. These groups are grass, wetland rice, leguminous crops, other upland crops and energy crops for both mixed and pastoral production systems (see Section 4.2.4). | For spatial allocation of the nutrient input to IMAGE grid cells, grass and the crop groups in IMAGE (temperate cereals, rice, maize, tropical cereals, pulses, roots and tubers, oil crops, other crops, energy crops) and grass are aggregated to five broad groups. These groups are grass, wetland rice, leguminous crops, other upland crops and energy crops for both mixed and pastoral production systems (see Section 4.2.4). | ||
Revision as of 16:16, 20 May 2014
Parts of Nutrients/Description
| Component is implemented in: |
| Components: |
| Related IMAGE components |
| Projects/Applications |
| Key publications |
| References |