Nutrients/Description: Difference between revisions
Jump to navigation
Jump to search
No edit summary |
Oostenrijr (talk | contribs) m (Text replacement - "et al. 2" to "et al., 2") |
||
| (20 intermediate revisions by 3 users not shown) | |||
| Line 1: | Line 1: | ||
{{ComponentDescriptionTemplate | {{ComponentDescriptionTemplate | ||
|Reference=Bouwman et al., 2013c; Van Drecht et al., 2009; Cleveland et al., 1999; | |Reference=Bouwman et al., 2013c; Van Drecht et al., 2009; Cleveland et al., 1999; Salvagiotti et al., 2008; Beusen et al., 2014; Beusen et al., 2015; Beusen et al., 2016; | ||
|Description====Wastewater=== | |Description====General=== | ||
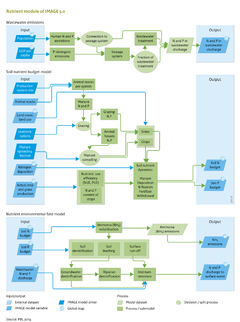
The IMAGE-Global Nutrient Model (GNM) is a global distributed spatially explicit model using hydrology as the basis for describing nitrogen (N) and phosphorus (P) delivery to surface water and transport and in-stream retention in rivers, lakes, wetlands and reservoirs. IMAGE-GNM is coupled to the PCR-GLOBWB global hydrological model ([[Van Beek et al., 2011]]). In the IMAGE-GNM model, grid cells receive water with dissolved and suspended N and P from upstream grid cells; inside grid cells, N and P are delivered to water bodies via diffuse sources (surface runoff, shallow and deep groundwater, riparian zones; litterfall in floodplains; atmospheric deposition) and point sources (wastewater); N and P retention in a water body is calculated on the basis of the residence time of the water and nutrient uptake velocity; subsequently, water and nutrients are transported to downstream grid cells. | |||
===Wastewater=== | |||
Urban wastewater contains N and P emitted by households and industries that are connected to a sewerage system, and households with sanitation but without a sewerage connection. | Urban wastewater contains N and P emitted by households and industries that are connected to a sewerage system, and households with sanitation but without a sewerage connection. | ||
N discharges to surface water (''E<sub>sw</sub><sup>N</sup>'' in kg per person per year) are calculated as follows ([[Van Drecht et al., 2009]]; [[Morée et al., 2013]]):{{FormulaAndTableTemplate| | N discharges to surface water (''E<sub>sw</sub><sup>N</sup>'' in kg per person per year) are calculated as follows ([[Van Drecht et al., 2009]]; [[Morée et al., 2013]]):{{FormulaAndTableTemplate|Formula1 Nutrients}}where: | ||
*''E<sub>hum</sub><sup>N</sup>'' is human N emissions (kg per person per year), | *''E<sub>hum</sub><sup>N</sup>'' is human N emissions (kg per person per year), | ||
* D is the proportion of the total population connected to public sewerage systems (no dimension), | * D is the proportion of the total population connected to public sewerage systems (no dimension), | ||
| Line 14: | Line 17: | ||
The soil budget approach ([[Bouwman et al., 2009]]; [[Bouwman et al., 2013c]]) considers all N and P inputs and outputs for IMAGE grid cells. N input terms in the budgets include application of synthetic N fertiliser (N<sub>fert</sub>) and animal manure (N<sub>man</sub>), biological N fixation (N<sub>fix</sub>), and atmospheric N deposition (N<sub>dep</sub>). Output terms include N withdrawal from the field through crop harvesting, hay and grass cutting, and grass consumed by grazing animals (N<sub>withdr</sub>). | The soil budget approach ([[Bouwman et al., 2009]]; [[Bouwman et al., 2013c]]) considers all N and P inputs and outputs for IMAGE grid cells. N input terms in the budgets include application of synthetic N fertiliser (N<sub>fert</sub>) and animal manure (N<sub>man</sub>), biological N fixation (N<sub>fix</sub>), and atmospheric N deposition (N<sub>dep</sub>). Output terms include N withdrawal from the field through crop harvesting, hay and grass cutting, and grass consumed by grazing animals (N<sub>withdr</sub>). | ||
The soil N budget (N<sub>budget</sub>) is calculated as follows:{{FormulaAndTableTemplate| | The soil N budget (N<sub>budget</sub>) is calculated as follows:{{FormulaAndTableTemplate|Formula2 Nutrients}} | ||
The same approach is used for P, with input terms being animal manure and fertiliser. The soil nutrient budget does not include nutrient accumulation in soil organic matter for a positive budget (surplus), or nutrient depletion due to soil organic matter decomposition and mineralisation. With no accumulation, a surplus represents a potential loss to the environment. For N this includes | The same approach is used for P, with input terms being animal manure and fertiliser. The soil nutrient budget does not include nutrient accumulation in soil organic matter for a positive budget (surplus), or nutrient depletion due to soil organic matter decomposition and mineralisation. With no accumulation, a surplus represents a potential loss to the environment. For N this includes NH<sub>3</sub> volatilisation (see Component [[Emissions]]), denitrification, surface runoff and leaching. For P, this is surface runoff. | ||
For spatial allocation of the nutrient input to IMAGE grid cells, grass and the crop groups in IMAGE (temperate cereals, rice, maize, tropical cereals, pulses, roots and tubers, oil crops, other crops, energy crops) and grass are aggregated to five broad groups. These groups are grass, wetland rice, leguminous crops, other upland crops and energy crops for both mixed and pastoral production systems (see [[Livestock systems]]). | For spatial allocation of the nutrient input to IMAGE grid cells, grass and the crop groups in IMAGE (temperate cereals, rice, maize, tropical cereals, pulses, roots and tubers, oil crops, other crops, energy crops) and grass are aggregated to five broad groups. These groups are grass, wetland rice, leguminous crops, other upland crops and energy crops for both mixed and pastoral production systems (see [[Livestock systems]]). | ||
| Line 23: | Line 26: | ||
====Manure==== | ====Manure==== | ||
Total manure production is computed from animal stocks and N and P excretion rates (Figure Flowchart, middle). IMAGE uses constant N and P excretion rates per head for dairy and non-dairy cattle, buffaloes, sheep and goats, pigs, poultry, horses, asses, mules and camels. Constant excretion rates imply that the N and P excretion per unit of product decreases with increased milk and meat production per animal. | |||
N and P in the manure for each animal category are spatially allocated to mixed and pastoral systems. In each country and system, the manure is distributed over three management systems: grazing; storage in animal housing and storage systems; and manure used outside the agricultural system for fuel or other purposes. The quantity of manure assigned to grazing is based on the proportion of grass in feed rations (Figure Flowchart, middle). | N and P in the manure for each animal category are spatially allocated to mixed and pastoral systems. In each country and system, the manure is distributed over three management systems: grazing; storage in animal housing and storage systems; and manure used outside the agricultural system for fuel or other purposes. The quantity of manure assigned to grazing is based on the proportion of grass in feed rations (Figure Flowchart, middle). | ||
| Line 29: | Line 32: | ||
Stored animal manure available for cropland and grassland application includes all stored and collected manure, excluding ammonia volatilisation from animal houses and storage systems. In general, IMAGE assumes that 50% of available animal manure from storage systems is applied to arable land and the rest to grassland in industrialised countries. In most developing countries, 95% of the available manure is spread on croplands and 5% on grassland, thus accounting for the lower economic importance of grass compared to crops in these countries. In the European Union, maximum manure application rates are 170 to 250 kg N per ha , reflecting current regulations. | Stored animal manure available for cropland and grassland application includes all stored and collected manure, excluding ammonia volatilisation from animal houses and storage systems. In general, IMAGE assumes that 50% of available animal manure from storage systems is applied to arable land and the rest to grassland in industrialised countries. In most developing countries, 95% of the available manure is spread on croplands and 5% on grassland, thus accounting for the lower economic importance of grass compared to crops in these countries. In the European Union, maximum manure application rates are 170 to 250 kg N per ha , reflecting current regulations. | ||
====Biological | ====Biological N<sub>2</sub> fixation==== | ||
Data on biological | Data on biological N<sub>2</sub> fixation by leguminous crops (pulses and soybeans) are obtained from the N in the harvested product (see nutrient withdrawal) following the approach of ([[Salvagiotti et al., 2008]]). Thus any change in the rate of biological N<sub>2</sub> fixation by legumes is the result of yield changes for pulses and soybeans. In addition to leguminous crops, IMAGE uses an annual rate of biological N<sub>2</sub> fixation of 5 kg N per ha for non-leguminous crops and grass, and 25 kg N per ha for wetland rice. N fixation rates in natural ecosystems were based on the low estimates for areal coverage by legumes ([[Cleveland et al., 1999]]) as described by Bouwman et al. ([[Bouwman et al., 2013a]]). | ||
====Atmospheric deposition==== | ====Atmospheric deposition==== | ||
| Line 36: | Line 39: | ||
====Nutrient withdrawal==== | ====Nutrient withdrawal==== | ||
Withdrawal of N and P in harvested products is calculated from regional crop production in IMAGE and the N and P content for each crop, which is aggregated to the broad crop categories (wetland rice, leguminous crops, upland crops and energy crops). IMAGE also accounts for uptake by fodder crops. N withdrawal through grass consumption and harvest is assumed to amount to 60% of all N input (manure, fertiliser, deposition, N fixation), excluding | Withdrawal of N and P in harvested products is calculated from regional crop production in IMAGE and the N and P content for each crop, which is aggregated to the broad crop categories (wetland rice, leguminous crops, upland crops and energy crops). IMAGE also accounts for uptake by fodder crops. N withdrawal through grass consumption and harvest is assumed to amount to 60% of all N input (manure, fertiliser, deposition, N fixation), excluding NH<sub>3</sub> volatilisation. P withdrawal through grazing or grass cutting is calculated as a proportion of 87.5% of fertiliser and manure P input. The rest is assumed to be lost through surface runoff. In calculating spatially nutrient withdrawal, a procedure is used to downscale regional crop production data from IMAGE to country estimates for nutrient withdrawal based on distributions in 2005. | ||
===Nutrient environmental fate=== | ===Nutrient environmental fate=== | ||
| Line 42: | Line 45: | ||
====Soil denitrification and leaching==== | ====Soil denitrification and leaching==== | ||
Denitrification is calculated as a proportion of the soil N budget surplus based on the effect of temperature and residence time of water and nitrate in the root zone, and the effects of soil texture, soil drainage and soil organic carbon content. In a soil budget deficit, IMAGE assumes that denitrification does not occur. Leaching is the complement of the soil N budget. | |||
====Groundwater transport, surface runoff and denitrification==== | ====Groundwater transport, surface runoff and denitrification==== | ||
| Line 52: | Line 55: | ||
# the approach includes the effect of pH on denitrification. | # the approach includes the effect of pH on denitrification. | ||
==== | ====Nutrients from vegetation in floodplains==== | ||
NPP from the LPJ model [[Carbon cycle and natural vegetation]] for wetlands and floodplains are used. Part of annual NPP is assumed to be deposited in the water during flooding, and where flooding is temporary, the litter from preceeding periods is assumed to be available for transport in the flood water. 50% of total NPP is assumed to end in the surface water. | |||
====Other direct sources of nutrients==== | |||
Other sources include aquaculture, weathering and atmospheric deposition. Deposition is from the same data as used for the land nutriënt budgets. Aquaculture is taken from data from two recent studies ([[Bouwman et al., 2011]]; [[Bouwman et al., 2013c]]), and weathering. The calculation of P release from weathering is based on a recent study ([[Hartmann et al., 2014]]) which uses the lithological classes distinguished by ([[Dürr et al., 2005]]). The lithological classes are available on a 5 by 5 minute resolution, hence the weighted average P concentration within each 0.5 by 0.5 degree grid cell is calculated. | |||
====In-stream nutrient retention==== | |||
The water that enters streams and rivers through surface runoff and discharges from groundwater and riparian zones is routed through stream and river channels, and passes through lakes, wetlands and reservoirs. The history of the construction of reservoirs during the 20th century is based on data from ([[Lehner et al., 2011]]). The nutrient retention in each of these systems is calculated on the basis of the nutrient spiralling ecological concept, which is based on residence time and temperature as described in ([[Beusen et al., 2014]]; [[Beusen et al., 2015]]). | |||
}} | }} | ||
Revision as of 14:44, 20 June 2017
Parts of Nutrients/Description
| Component is implemented in: |
| Components: |
| Related IMAGE components |
| Projects/Applications |
| Key publications |
| References |