Nutrients/Description: Difference between revisions
Jump to navigation
Jump to search
Oostenrijr (talk | contribs) No edit summary |
No edit summary |
||
| Line 1: | Line 1: | ||
{{ComponentDescriptionTemplate | {{ComponentDescriptionTemplate | ||
|Reference=Bouwman et al., 2013c; Van Drecht et al., 2009; Cleveland et al., 1999; Salvagiotti et al., 2008; Beusen et al., 2014; | |Reference=Bouwman et al., 2013c; Van Drecht et al., 2009; Cleveland et al., 1999; Salvagiotti et al., 2008; Beusen et al., 2014; Beusen et al., 2015; Beusen et al., 2016; | ||
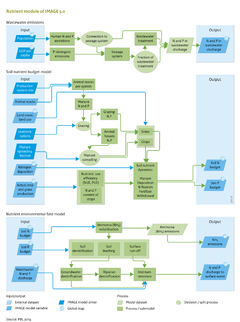
|Description====Wastewater=== | |Description====Wastewater=== | ||
Urban wastewater contains N and P emitted by households and industries that are connected to a sewerage system, and households with sanitation but without a sewerage connection. | Urban wastewater contains N and P emitted by households and industries that are connected to a sewerage system, and households with sanitation but without a sewerage connection. | ||
| Line 30: | Line 30: | ||
====Biological N<sub>2</sub> fixation==== | ====Biological N<sub>2</sub> fixation==== | ||
Data on biological N<sub>2</sub> fixation by leguminous crops (pulses and soybeans) are obtained from the N in the harvested product (see nutrient withdrawal) following the approach of ([[Salvagiotti et al., 2008]]). Thus any change in the rate of biological N<sub>2</sub> fixation by legumes is the result of yield changes for pulses and soybeans. In addition to leguminous crops, IMAGE uses an annual rate of biological N<sub>2</sub> fixation of 5 kg N per ha for non-leguminous crops and grass, and 25 kg N per ha for wetland rice. N fixation rates in natural ecosystems were based on the low estimates for areal coverage by legumes ([[Cleveland et al., 1999]]) as described by Bouwman et al. ([[Bouwman et al., | Data on biological N<sub>2</sub> fixation by leguminous crops (pulses and soybeans) are obtained from the N in the harvested product (see nutrient withdrawal) following the approach of ([[Salvagiotti et al., 2008]]). Thus any change in the rate of biological N<sub>2</sub> fixation by legumes is the result of yield changes for pulses and soybeans. In addition to leguminous crops, IMAGE uses an annual rate of biological N<sub>2</sub> fixation of 5 kg N per ha for non-leguminous crops and grass, and 25 kg N per ha for wetland rice. N fixation rates in natural ecosystems were based on the low estimates for areal coverage by legumes ([[Cleveland et al., 1999]]) as described by Bouwman et al. ([[Bouwman et al., 2013a]]). | ||
====Atmospheric deposition==== | ====Atmospheric deposition==== | ||
Revision as of 14:31, 2 November 2016
Parts of Nutrients/Description
| Component is implemented in: |
| Components: |
| Related IMAGE components |
| Projects/Applications |
| Key publications |
| References |