Energy conversion/Description: Difference between revisions
Jump to navigation
Jump to search
Oostenrijr (talk | contribs) m (Text replacement - "Koberle et al., 2015" to "Köberle et al., 2015") |
Oostenrijr (talk | contribs) No edit summary |
||
| Line 1: | Line 1: | ||
{{ComponentDescriptionTemplate | {{ComponentDescriptionTemplate | ||
|Reference=Hoogwijk, 2004; Van Vuuren, 2007; Hendriks et al., 2004b; Van Ruijven et al., 2007; Ueckerdt et al., 2016; Gernaat et al., 2014; Köberle et al., 2015; De Boer and Van Vuuren, | |Reference=Hoogwijk, 2004; Van Vuuren, 2007; Hendriks et al., 2004b; Van Ruijven et al., 2007; Ueckerdt et al., 2016; Gernaat et al., 2014; Köberle et al., 2015; De Boer and Van Vuuren, 2017; | ||
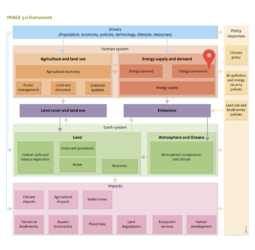
|Description=[[TIMER model|TIMER]] includes two main energy conversion modules: Electric power generation and hydrogen generation. Below, electric power generation is described in detail. In addition, the key characteristics of the hydrogen generation model, which follows a similar structure, are presented. | |Description=[[TIMER model|TIMER]] includes two main energy conversion modules: Electric power generation and hydrogen generation. Below, electric power generation is described in detail. In addition, the key characteristics of the hydrogen generation model, which follows a similar structure, are presented. | ||
===Electric power generation=== | ===Electric power generation=== | ||
<div class="version newv31"> | <div class="version newv31"> | ||
In TIMER, electricity can be generated by 28 technologies. These include the VRE sources solar photovoltaics (PV), concentrated solar power (CSP), and onshore and offshore wind power. Other technology types are natural gas-, coal-, biomass- and oil-fired power plants. These power plants come in multiple variations: conventional, combined cycle, carbon capture and storage (CCS) and combined heat and power (CHP). The electricity sector in TIMER also describes the use of nuclear, other renewables (mainly geothermal power) and hydroelectric power. ([[De Boer and Van Vuuren, | In TIMER, electricity can be generated by 28 technologies. These include the VRE sources solar photovoltaics (PV), concentrated solar power (CSP), and onshore and offshore wind power. Other technology types are natural gas-, coal-, biomass- and oil-fired power plants. These power plants come in multiple variations: conventional, combined cycle, carbon capture and storage (CCS) and combined heat and power (CHP). The electricity sector in TIMER also describes the use of nuclear, other renewables (mainly geothermal power) and hydroelectric power. ([[De Boer and Van Vuuren, 207]]) | ||
</div> | </div> | ||
<div class="version changev31"> | <div class="version changev31"> | ||
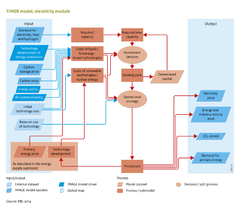
As shown in the flowchart, two key elements of the electric power generation are the investment strategy and the operational strategy in the sector. A challenge in simulating electricity production in an aggregated model is that in reality electricity production depends on a range of complex factors, related to costs, reliance, and technology ramp rates. Modelling these factors requires a high level of detail and thus IAMs, such as TIMER, concentrate on introducing a set of simplified, meta relationships ([[Hoogwijk, 2004]]; [[Van Vuuren, 2007]]; [[De Boer and Van Vuuren, | As shown in the flowchart, two key elements of the electric power generation are the investment strategy and the operational strategy in the sector. A challenge in simulating electricity production in an aggregated model is that in reality electricity production depends on a range of complex factors, related to costs, reliance, and technology ramp rates. Modelling these factors requires a high level of detail and thus IAMs, such as TIMER, concentrate on introducing a set of simplified, meta relationships ([[Hoogwijk, 2004]]; [[Van Vuuren, 2007]]; [[De Boer and Van Vuuren, 2017]]). | ||
</div> | </div> | ||
| Line 25: | Line 25: | ||
In the model, the decision to invest in generation technologies is based on the levelized cost of electricity (LCOE; in USD/kWhe) produced per technology, using a multinomial logit equation that assigns larger market shares to the lower cost options. | In the model, the decision to invest in generation technologies is based on the levelized cost of electricity (LCOE; in USD/kWhe) produced per technology, using a multinomial logit equation that assigns larger market shares to the lower cost options. | ||
An important variable used in determining the LCOE is the amount of electricity generated. Often, the LCOEs of technologies are compared at maximum full load hours. However, only a limited share of the installed capacity will actually generate electricity at full load. This effect is captured in a heuristic: 20 different load bands have been introduced to link the investment decision to expected dispatch. The different load bands are distributed among the LDC, resulting in a load factor for each load band. The inclusion of different load factors for each load band means that less capital-intensive technologies are attractive to use for lower load factor load bands. These are likely to be gas-fired peaker plants. For load bands with higher load factors, the electricity submodule chooses technologies with lower operational costs. These are likely to be base load plants, such as coal-fired or nuclear power plants. A system with more VRE sources will result in lower load factors and therefore in a higher demand for peak or mid load technologies. ([[De Boer and Van Vuuren, | An important variable used in determining the LCOE is the amount of electricity generated. Often, the LCOEs of technologies are compared at maximum full load hours. However, only a limited share of the installed capacity will actually generate electricity at full load. This effect is captured in a heuristic: 20 different load bands have been introduced to link the investment decision to expected dispatch. The different load bands are distributed among the LDC, resulting in a load factor for each load band. The inclusion of different load factors for each load band means that less capital-intensive technologies are attractive to use for lower load factor load bands. These are likely to be gas-fired peaker plants. For load bands with higher load factors, the electricity submodule chooses technologies with lower operational costs. These are likely to be base load plants, such as coal-fired or nuclear power plants. A system with more VRE sources will result in lower load factors and therefore in a higher demand for peak or mid load technologies. ([[De Boer and Van Vuuren, 2017]]) | ||
The standard costs of each option can be broken down into several categories: investment or capital cost; fuel cost; fixed and variable operational and maintenance costs; construction costs; and carbon capture and storage costs. | The standard costs of each option can be broken down into several categories: investment or capital cost; fuel cost; fixed and variable operational and maintenance costs; construction costs; and carbon capture and storage costs. | ||
| Line 40: | Line 40: | ||
* Transmission and distribution costs are simulated by adding a fixed relationship between the amount of capacity and the required amount of transmission and distribution capital. VRE cost supply curves contain additional transmission costs resulting from distance between VRE potential and demand centres. | * Transmission and distribution costs are simulated by adding a fixed relationship between the amount of capacity and the required amount of transmission and distribution capital. VRE cost supply curves contain additional transmission costs resulting from distance between VRE potential and demand centres. | ||
The exceptions are hydropower, other renewables and CHP. Hydropower and other renewables are exogenously prescribed, because of a lack of available data or because technologies like large hydropower plants often have additional functions such as water supply and flood control. The demand for CHP capacity is heat demand driven. ([[De Boer and Van Vuuren, | The exceptions are hydropower, other renewables and CHP. Hydropower and other renewables are exogenously prescribed, because of a lack of available data or because technologies like large hydropower plants often have additional functions such as water supply and flood control. The demand for CHP capacity is heat demand driven. ([[De Boer and Van Vuuren, 2017]]) | ||
Finally, in the equations, some constraints are added to account for limitations in supply, for example restrictions on biomass availability. For a more detailed description on electricity sector investments in TIMER, see | Finally, in the equations, some constraints are added to account for limitations in supply, for example restrictions on biomass availability. For a more detailed description on electricity sector investments in TIMER, see [[De Boer and Van Vuuren, 2017]]).</div> | ||
</div> | |||
====Operational strategy==== | ====Operational strategy==== | ||
Revision as of 08:58, 13 June 2018
Parts of Energy conversion/Description
| Component is implemented in: |
|
| Related IMAGE components |
| Projects/Applications |
| Models/Databases |
| Key publications |
| References |