Emissions: Difference between revisions
Jump to navigation
Jump to search
m (Text replace - "Animal stock" to "Animal stocks") |
No edit summary |
||
| Line 1: | Line 1: | ||
{{ComponentTemplate2 | {{ComponentTemplate2 | ||
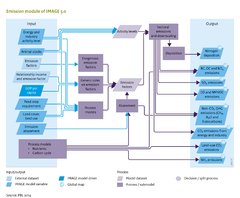
|Application=Roads from Rio+20 (2012) project; | |Application=Roads from Rio+20 (2012) project; | ||
|KeyReference= | |KeyReference=Van Vuuren et al., 2006; | ||
|InputVar=Energy and industry activity level; Feed crop requirement; Animal stocks; Land cover, land use - grid; Emission abatement; GDP per capita; | |InputVar=Energy and industry activity level; Feed crop requirement; Animal stocks; Land cover, land use - grid; Emission abatement; GDP per capita; | ||
|Parameter=Emission factors; Relationship income and emission factor; | |Parameter=Emission factors; Relationship income and emission factor; | ||
|OutputVar=CO2 emission from energy and industry; CO and NMVOC emissions; Non-CO2 GHG emissions (CH4, N2O and Halocarbons); BC, OC and NOx emissions; SO2 emissions; Nitrogen deposition - grid; | |OutputVar=CO2 emission from energy and industry; CO and NMVOC emissions; Non-CO2 GHG emissions (CH4, N2O and Halocarbons); BC, OC and NOx emissions; SO2 emissions; Nitrogen deposition - grid; | ||
Revision as of 16:24, 1 May 2014
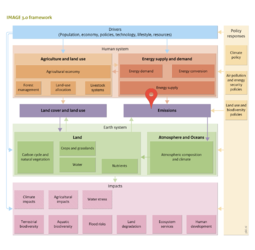
Parts of Emissions
| Component is implemented in: |
Components:and
|
| Projects/Applications |
| Models/Databases |
| Key publications |
Key policy issues
- How will emissions of greenhouse gases and air pollutants develop in scenarios with and without policy interventions, such as climate policy and air pollution control?
- What synergies between climate policy and air pollution control can be identified?