Emissions/Description: Difference between revisions
Jump to navigation
Jump to search
Oostenrijr (talk | contribs) m (Text replace - "SF6" to "SF<sub>6</sub>") |
Oostenrijr (talk | contribs) m (Text replace - "NH3" to "NH<sub>3</sub>") |
||
| Line 30: | Line 30: | ||
4) ''Gridded process model (GPM)'' | 4) ''Gridded process model (GPM)'' | ||
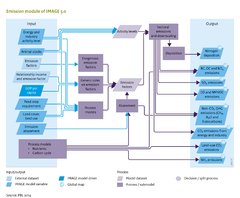
:Land-use related emissions of | :Land-use related emissions of NH<sub>3</sub>, N<sub>2</sub>O and NO are calculated with grid-specific models (Figure Flowchart). The models included in IMAGE are simple regression models that generate an emission factor (Figure Flowchart). For comparison with other models, IMAGE also includes the N<sub>2</sub>O methodology generally proposed by {{abbrTemplate|IPCC}} ([[IPCC, 2006]]). | ||
The approaches used to calculate emissions from energy production and use, industrial processes and land-use related sources are discussed in more detail below. | The approaches used to calculate emissions from energy production and use, industrial processes and land-use related sources are discussed in more detail below. | ||
| Line 59: | Line 59: | ||
===Land-use related emissions=== | ===Land-use related emissions=== | ||
CO<sub>2</sub> exchanges between terrestrial ecosystems and the atmosphere computed by the LPJ model are described in [[Carbon cycle and natural vegetation]]. The land-use emissions model focuses on emissions of other compounds, including greenhouse gases (CH<sub>4</sub>, N<sub>2</sub>O), ozone precursors (NO<sub>x</sub>, CO, NMVOC), acidifying compounds (SO<sub>2</sub>, | CO<sub>2</sub> exchanges between terrestrial ecosystems and the atmosphere computed by the LPJ model are described in [[Carbon cycle and natural vegetation]]. The land-use emissions model focuses on emissions of other compounds, including greenhouse gases (CH<sub>4</sub>, N<sub>2</sub>O), ozone precursors (NO<sub>x</sub>, CO, NMVOC), acidifying compounds (SO<sub>2</sub>, NH<sub>3</sub>) and aerosols (SO<sub>2</sub>, NO3, BC, OC). | ||
For many sources, the emission factor ([[#General approaches|Equation 1]]) is used ([[Emission table]]). Most emission factors for anthropogenic sources are from the [[EDGAR database]], with time-dependent values for historical years. In the scenario period, most emission factors are constant, except for explicit climate abatement policies (see below). | For many sources, the emission factor ([[#General approaches|Equation 1]]) is used ([[Emission table]]). Most emission factors for anthropogenic sources are from the [[EDGAR database]], with time-dependent values for historical years. In the scenario period, most emission factors are constant, except for explicit climate abatement policies (see below). | ||
| Line 69: | Line 69: | ||
A special case is N<sub>2</sub>O emissions after forest clearing. After deforestation, litter remaining on the soil surface as well as root material and soil organic matter decompose in the first years after clearing, which may lead to pulses of N<sub>2</sub>O emissions. To mimic this effect, emissions in the first year after clearing are assumed to be five times the flux in the original ecosystem. Emissions decrease linearly to the level of the new ecosystem in the tenth year, usually below the flux in the original forest. For more details, see Kreileman and Bouwman ([[Kreileman and Bouwman, 1994|1994]]). | A special case is N<sub>2</sub>O emissions after forest clearing. After deforestation, litter remaining on the soil surface as well as root material and soil organic matter decompose in the first years after clearing, which may lead to pulses of N<sub>2</sub>O emissions. To mimic this effect, emissions in the first year after clearing are assumed to be five times the flux in the original ecosystem. Emissions decrease linearly to the level of the new ecosystem in the tenth year, usually below the flux in the original forest. For more details, see Kreileman and Bouwman ([[Kreileman and Bouwman, 1994|1994]]). | ||
Land-use related emissions of | Land-use related emissions of NH<sub>3</sub>, N<sub>2</sub>O and NO are calculated withgrid-specific models.N<sub>2</sub>O from soils under natural vegetation is calculated with the model developed by Bouwman et al. (1993). This regression model is based on temperature, a proxy for soil carbon input, soil water and oxygen status, and for net primary production. Ammonia emissions from natural vegetation are calculated from net primary production, C:N ratio and an emission factor. The model accounts for in-canopy retention of the emitted NH<sub>3</sub> ([[Bouwman et al., 1997]]). | ||
For N<sub>2</sub>O emissions from agriculture, the determining factors in IMAGE are N application rate, climate type, soil organic carbon content, soil texture, drainage, soil pH, crop type, and fertiliser type. The main factors used to calculate NO emissions include N application rate per fertiliser type, and soil organic carbon content and soil drainage (for detailed description, see Bouwman et al. ([[Bouwman et al., 2002a|2002a]]). For | For N<sub>2</sub>O emissions from agriculture, the determining factors in IMAGE are N application rate, climate type, soil organic carbon content, soil texture, drainage, soil pH, crop type, and fertiliser type. The main factors used to calculate NO emissions include N application rate per fertiliser type, and soil organic carbon content and soil drainage (for detailed description, see Bouwman et al. ([[Bouwman et al., 2002a|2002a]]). For NH<sub>3</sub> emissions from fertilised cropland and grassland, the factors used in IMAGE are crop type, fertiliser application rate per type and application mode, temperature, soil pH, and CEC ([[Bouwman et al., 2002a]]). | ||
For comparison with other models, IMAGE also includes the N<sub>2</sub>O methodology proposed by IPCC ([[IPCC, 2006|2006]]). This methodology represents only anthropogenic emissions. For emissions from fertilizer fields this is the emission from a fertilized plot minus that from a control plot with zero fertilizer application. For this reason, soil emissions calculated with this methodology cannot be compared with the above model approaches, which yields total N<sub>2</sub>O emissions. | For comparison with other models, IMAGE also includes the N<sub>2</sub>O methodology proposed by IPCC ([[IPCC, 2006|2006]]). This methodology represents only anthropogenic emissions. For emissions from fertilizer fields this is the emission from a fertilized plot minus that from a control plot with zero fertilizer application. For this reason, soil emissions calculated with this methodology cannot be compared with the above model approaches, which yields total N<sub>2</sub>O emissions. | ||
Revision as of 10:39, 1 July 2014
Parts of Emissions/Description
| Component is implemented in: |
Components:and
|
| Projects/Applications |
| Models/Databases |
| Key publications |
| References |
|