Drivers/Scenario drivers: Difference between revisions
Oostenrijr (talk | contribs) No edit summary |
Oostenrijr (talk | contribs) No edit summary |
||
| Line 3: | Line 3: | ||
|Sequence=2 | |Sequence=2 | ||
|Reference=PBL, 2010; PBL, 2011; OECD, 2008; Moss et al., 2010; IIASA, 2013; UN, 2013; Lutz and KC, 2010; Van Vuuren et al., 2007b; Chateau et al., 2013; | |Reference=PBL, 2010; PBL, 2011; OECD, 2008; Moss et al., 2010; IIASA, 2013; UN, 2013; Lutz and KC, 2010; Van Vuuren et al., 2007b; Chateau et al., 2013; | ||
}}<div class="page_standard"> | |||
<h2>Scenario drivers</h2> | |||
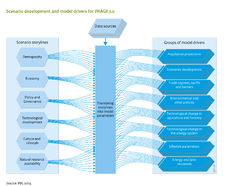
On the basis of how the world may develop in the longer term, the following six key scenario drivers are distinguished: demography, economy, culture and lifestyle, natural resource availability, technological development, and policy and governance, see flowchart. The future direction of these drivers is often inferred from the storyline or narrative, which may range from brief to very detailed. The storyline describes the following scenario types and functions: | On the basis of how the world may develop in the longer term, the following six key scenario drivers are distinguished: demography, economy, culture and lifestyle, natural resource availability, technological development, and policy and governance, see flowchart. The future direction of these drivers is often inferred from the storyline or narrative, which may range from brief to very detailed. The storyline describes the following scenario types and functions: | ||
*reference projection with no new policies ([[OECD, 2008]]); | *reference projection with no new policies ([[OECD, 2008]]); | ||
| Line 50: | Line 51: | ||
===Relationships between scenario drivers=== | ===Relationships between scenario drivers=== | ||
Assumptions made in one of the six scenario drivers depend, to a lesser or greater extent, on assumptions in one or more of the other scenario drivers. Thus, the plausibility of a set of drivers and of an individual driver hinges on careful consideration of the nature and direction of these relationships. An overarching story or narrative has proven helpful in selecting meaningful combinations of scenario drivers ([[IPCC, 2000]]; [[MA, 2005]]). | Assumptions made in one of the six scenario drivers depend, to a lesser or greater extent, on assumptions in one or more of the other scenario drivers. Thus, the plausibility of a set of drivers and of an individual driver hinges on careful consideration of the nature and direction of these relationships. An overarching story or narrative has proven helpful in selecting meaningful combinations of scenario drivers ([[IPCC, 2000]]; [[MA, 2005]]). | ||
</div> | |||
Revision as of 09:09, 19 November 2018
Parts of Drivers/Scenario drivers
| Projects/Applications |
| Models/Databases |
| Relevant overviews |
| Key publications |
| References |
Scenario drivers
On the basis of how the world may develop in the longer term, the following six key scenario drivers are distinguished: demography, economy, culture and lifestyle, natural resource availability, technological development, and policy and governance, see flowchart. The future direction of these drivers is often inferred from the storyline or narrative, which may range from brief to very detailed. The storyline describes the following scenario types and functions:
- reference projection with no new policies (OECD, 2008);
- single ‘best guess’ projection combining past trends with assumptions on how they may develop (PBL, 2010; PBL, 2011);
- multiple contrasting scenarios that span a range of uncertainties about the future (IPCC, 2000; MA, 2005; Moss et al., 2010; IIASA, 2013);
- specific or broad policy scenarios directed to improving future outcomes (OECD, 2012; PBL, 2012).
Demography
The future state of the world depends on the population because total demand for goods and services equals the number of people times demand per capita.
Most population projections used as input to the IMAGE model have been adopted from published sources, such as data from the United Nations (UN, 2013) and projections by the International Institute for Applied Systems Analysis (IIASA) (Lutz and KC, 2010). Behind these numerical projections are economic, technical, educational and policy assumptions that determine the estimated future population as the net outcome of fertility and mortality, adjusted for migration flows. This has provided internally consistent, overall population scenarios on the basis of underlying demographic trends.
In addition to total number of people, the population is broken down into gender, income classes, urban and rural, and educational level. These attributes are relevant for issues such as consumption preferences and patterns, and access to goods and services. Using a downscaling procedure (Van Vuuren et al., 2007b), national and regional population can be projected at grid level to account for trends in urbanisation and migration within countries and regions.
Population data are used in energy and agricultural economics modelling, and in other IMAGE modules, such as water stress, nutrients, flood risks and human health.
Economy
At the most aggregated level, economic activity is described in terms of gross domestic product (GDP) per capita. Models outside the IMAGE 3.0 framework, such as the OECD ENV-Growth model, project long-term GDP growth based on developments in key production factors (e.g., capital, labour, natural resources), and the sector composition of the economy. The various components of GDP on the production side (in particular value added (VA) per sector) and expenditures (in particular private consumption) are estimated with more detailed models that take account of inter-sector linkages, own- and cross-price responses, and other factors Chateau et al., 2013.
In IMAGE 3.0, economic variables are used as model drivers for the energy demand model , and non-agricultural water demand contributing to water stress, see (Water model. To meet the requirements of the household energy demand model, average income is broken down into urban and rural population, and each population into quintiles of income levels. The latter is derived from the assumed uneven income distribution using the GINI factor, a measure of income disparity in a population. The macro indicator GDP per capita is also used directly in IMAGE components, such as human health, flood risks, and nutrients (for calculating urban wastewater). The agriculture model MAGNET is an economy-wide computable general equilibrium (CGE) model that reproduces exogenous GDP growth projections made in less complex economic growth models, see Agricultural economy.
Policy and governance
Scenarios may differ considerably with regard to assumptions on implicit or explicit policies that reflect alternative future developments in human and natural systems, and assumptions on the evolution of governance structures and institutional settings. While policy thinking may vary, a key scenario split in IMAGE is more focus on the shorter term and/or on material wealth, or focus on longer term sustainability concerns. Based on this, inter-regional and/or inter-generational equity may be awarded more or less weight as an underlying future trend. As mentioned under culture and lifestyle, such assumed directions in overall policy have the potential to influence almost all relevant scenarios and model drivers.
In addition to alternative policy directions, other important factors are developments in governance structures and institutions in different world regions, or in groups of regions sharing certain characteristics. For instance, this may concern high-income industrialised countries, medium income emerging economies, or low-income developing countries.
Other elements may also make some policy measures and instruments more or less plausible. For example, a concerted and jointly implemented global climate mitigation strategy is less conceivable in a world with diverging regions primarily pre-occupied with short-term domestic interests and weak intergovernmental bodies.
Technological development
At scenario level, the assumed technical progress is the key driver of economic growth. Given an effective labour force, the increase in labour productivity delineates the potential for economic growth. In scenarios, it is generally assumed that the degree of technical progress is reflected in all areas where technology plays a role. Thus, an assumed rapid growth in technology leading to high economic growth implies that technological options in specific sectors (e.g., energy and agriculture) will also develop relatively quickly. However, the directions of technological change may differ within and across sectors. For example, renewable energy technologies may improve more rapidly than fossil fuel based technology. Thus, this is an uncertain factor.
In the energy sector (see Energy supply and demand), technology improvements over time are largely governed by an endogenous mechanism that links technology cost to the cumulative capacity, learning by doing. Technological factors in agriculture are estimated exogenously, based on historical data and projections from the literature on crop and livestock productivity, efficiency in water and fertiliser use, and performance of irrigation systems.
Culture and lifestyle
For comparable levels of affluence, observed consumption behaviour differs greatly between countries and regions, and to a lesser extent within countries. The modal split for passenger transport by walking, bicycle, car, bus, train, boat and aircraft depends on income, but also on engrained traditions and habits of social groups. Food preferences depend on availability and affordability, and also greatly on cultural factors, such as religion (e.g., no pork for Jewish and Islamic households, and no beef or no meat at all for Hindus), and on tradition, values and health concerns. In addition, behaviour may be influenced by concerns about environmental degradation, animal welfare, inter-regional and inter-generational equity, and other issues according to dominant social norms and values.
Consumer preferences and lifestyles may change over time, as may norms and values. The direction and rates of change can be inferred from the underlying scenario storyline. Policies may be put in place to enable, encourage or even induce change, given sufficient public support.
Natural resource availability
The term, ultimate natural resources, refers to the amount of resources theoretically available if not affected by human activity. For non-renewable resources, such as coal and iron ore, this concerns the accumulated amount before human extraction began. For renewable resources, such as solar energy, it represents the solar radiation intercepted on Earth in a given time period. As the ultimate quantities of these natural resources cannot be changed by humans, they cannot be considered as scenario drivers in IMAGE. Similarly, the global land area is fixed, except for relatively limited reclaimed areas in shallow coastal waters and natural processes by which land area is increased (e.g., volcanic islands) and land area is reduced (e.g., coastal erosion).
The quantity of a resource available in the future depends on exogenous assumptions for the scenarios. The estimated quantities depend on the assumed future technology capabilities, policies and human preferences. Higher estimates of non-conventional fossil fuels and nuclear fuel reserves are associated with technology optimism, for example, estimates of natural gas reserves depend on whether the extraction of deep seabed methane is considered a viable option. Nature conservation and other issues may limit the potential for natural land conversion for agriculture, but may also impose limits on hydroelectricity generation.
In IMAGE 3.0, renewable and non-renewable energy resources are modelled by volume and price, see Component Energy supply. Similarly, the potential land for agriculture ranked according to suitability and is subject to nature conservation policies, limits future land conversion, see Component Land-use allocation.
Relationships between scenario drivers
Assumptions made in one of the six scenario drivers depend, to a lesser or greater extent, on assumptions in one or more of the other scenario drivers. Thus, the plausibility of a set of drivers and of an individual driver hinges on careful consideration of the nature and direction of these relationships. An overarching story or narrative has proven helpful in selecting meaningful combinations of scenario drivers (IPCC, 2000; MA, 2005).