Land-use allocation/Description: Difference between revisions
Jump to navigation
Jump to search
No edit summary |
No edit summary |
||
| Line 28: | Line 28: | ||
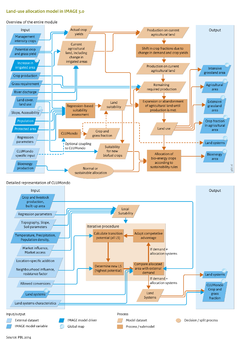
For each region, between two and four variables are found to be significant explanatory factors for 2005 land use. For example, population density is a significant determinant in almost all regions. Terrain slope is a key determinant in many regions, including North America, Europe and Asia; accessibility in South America, Africa and Australia; and potential yield in the Americas, Europe and North Africa. | For each region, between two and four variables are found to be significant explanatory factors for 2005 land use. For example, population density is a significant determinant in almost all regions. Terrain slope is a key determinant in many regions, including North America, Europe and Asia; accessibility in South America, Africa and Australia; and potential yield in the Americas, Europe and North Africa. | ||
The region-specific regression models are used in IMAGE to calculate the suitability of land areas in annual time-steps. | The region-specific regression models are used in IMAGE to calculate the suitability of land areas in annual time-steps. In addition to the suitability assessment, a random factor is included to account for inherent uncertainty and non-deterministic behaviour of land-use change processes, allowing the emergence of new agricultural patches. Agricultural land is expanded according to the final suitability ranking. Extensive pastures located in areas where the natural vegetation is grassland are assumed to be rather constant over time, and thus do not expand and are only abandoned as a result of climate change. | ||
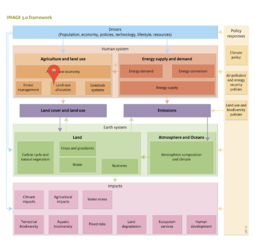
Land use in IMAGE is modelled using dominant land use types per grid cell on a 5 x 5 minute resolution. In reality, land use is more heterogeneous. For some applications, dominant land use on 5 x 5 minute resolution, or the derived proportional land use on a 30 x 30 minute resolution may be sufficient. However, many applications require higher resolution and additional data, such as studies on biodiversity and agricultural intensification ([[Verburg et al., 2013]]). | Land use in IMAGE is modelled using dominant land use types per grid cell on a 5 x 5 minute resolution. In reality, land use is more heterogeneous. For some applications, dominant land use on 5 x 5 minute resolution, or the derived proportional land use on a 30 x 30 minute resolution may be sufficient. However, many applications require higher resolution and additional data, such as studies on biodiversity and agricultural intensification ([[Verburg et al., 2013]]). | ||
}} | }} | ||
Revision as of 15:35, 4 November 2016
Parts of Land-use allocation/Description
| Component is implemented in: |
| Components: |
| Related IMAGE components |
| Projects/Applications |
| Key publications |
| References |