Land-use allocation/Description: Difference between revisions
Jump to navigation
Jump to search
m (Text replace - "|Status=On hold" to "") |
No edit summary |
||
| Line 1: | Line 1: | ||
{{ComponentDescriptionTemplate | {{ComponentDescriptionTemplate | ||
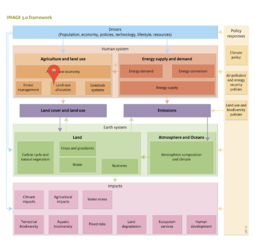
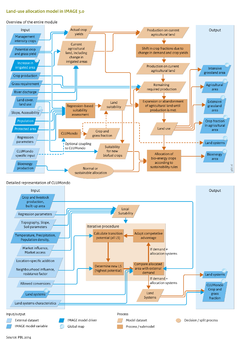
|Description=IMAGE 3.0 has two methods to represent land-use dynamics and to determine the location of new agricultural lands. For applications not focusing on land-use dynamics, a simple regression-based suitability assessment is used to determine future land-use patterns. A dynamic link to CLUMondo (Van Asselen and Verburg, 2013) enables more detailed representation of land-use systems and their dynamics. Both approaches are embedded in the IMAGE land-use allocation model (see flowchart). | |||
Both approaches are driven by regional crop and grassland production and their respective intensity levels, as calculated by the IMAGE agro-economic model ([[Agricultural economy and forestry]]). Agricultural land use is allocated to grid cells in an iterative process until the required regional production of crops and grass is met. Land use in IMAGE is modelled using dominant land use per grid cell on a 5 x 5 minute resolution, distinguishing extensive grasslands, agricultural and non-agricultural grid cells, and within agricultural land areas fractions of grass, seven rain-fed and seven irrigated crop types, and bioenergy crops. | |||
In each time step, maps of actual crop yields are computed by combining the potential crop and grassland yields calculated by the crop model ([[Crop and grass]]), and the regional management intensity from the agro-economic model ([[Agricultural economy and forestry]]). Starting with the land-cover and land-use map of the previous time step, actual yields are used to determine crop and grassland production on current agricultural land. This is compared to the required regional crop and grassland production. If the demand exceeds calculated production, the agricultural area needs to be expanded at the cost of natural vegetation. If the calculated production of current cropland exceeds the required production, agricultural land is abandoned to adjust to the production required. | |||
Crop and grassland is either abandoned or expanded until the required production is met. Since actual yields are taken into account, changes in crop yields in time due to technological change, climate change and land heterogeneity are included. If yields in the new agricultural areas are lower than average in the current area, relatively more agricultural land is required compared to the production increase. | |||
In determining the location of agricultural expansion or abandonment, all grid cells are assessed and ranked on suitability, based on an empirical regression analysis, and optionally based on a link to CLUMondo (see further below). | |||
Additionally, a few other rules are applied in determining the location of new agricultural land. For instance, agricultural expansion is not permitted in protected areas, and in areas otherwise protected, such as in assumed REDD (reducing emissions from deforestation and degradation) schemes. A grid cell is only regarded suitable for agriculture if the potential rain-fed production is at least 5% of the global maximum attainable crop yield. Grid cells with a production potential between 0.05 and 5% of the maximum attainable are still assumed suitable for extensive grassland. | |||
Irrigated areas are increased on a regional scale, prescribed by external scenario dependent assumptions, such as based on FAO ([[Alexandratos and Bruinsma, 2012]]). In each time-step, more irrigated areas are allocated in agricultural land based on the need for irrigation (the difference in rain-fed and irrigated yields), and water availability. | |||
In agricultural areas, the fraction of specific crops is determined based on the initial fractions, and modified annually based on changes in regional demand and local crop yields. As a result, the land-use fraction of a certain crop increases when the demand for this crop increases faster than for other crops, or if the potential yield in this grid cell increases more than for other crops. | |||
The land use allocation model enables new land-use and land cover maps to be created ([[Land cover and use]]). These land-use maps specify agricultural land, extensive grassland, and, land for sustainable bioenergy production. Crop fractions are allocated for all 18 crop types in IMAGE (temperate cereals, rice, maize, tropical cereals, roots and tubers, pulses, and oil crops, both rain-fed and irrigated; grass: and sugar cane, maize for bioenergy and woody and non-woody bioenergy). These data are calculated on a 5 minute resolution, and aggregated to proportional land use on 30 minute resolution of the carbon, crop and water model [[LPJmL model|LPJmL]]. Additional data layers are provided when linked to CLUMondo (see [[#CLUMondo|below]]). | |||
==Empirical regression analysis to determine land use suitability== | |||
Land-use change is determined by various factors, such as climate and climate variability, soil and terrain characteristics, and socio-economic variables, such as population density and accessibility ([[O'Neill, 2013]]). Land-use change dynamics differ substantially between regions ([[Lambin et al., 2000]]). These characteristics are taken into account in IMAGE 3.0 in a regional suitability assessment based on an empirical multiple linear regression analysis. | |||
The suitability assessment includes data on two biophysical determinants: the potential yield which covers effects of climate and soil ([[Crop and grass]]), and the terrain slope index ([[IIASA, 2012]]) based on [[HasAcronym::SRTM]] elevation data (Shuttle Radar Topography Mission) from NASA. Two socio-economic determinants are included: population density ([[Klein Goldewijk et al., 2010]]), and the accessibility index from JRC ([[Nelson, 2008]]), which is defined as minutes travel time to major cities (>50,000 inhabitants). | |||
These four independent variables are used in multiple linear regression analysis to investigate the relationship between these land-use determinants and current land use (fractions of crop and grassland in 2005 from [[Klein Goldewijk et al., (2011)]]). The analysis is performed separately for each IMAGE region, and takes into account the logarithmic relationship found for all independent variables except for potential crop yield. | |||
For each region, between two and four variables are found to be significant explanatory factors for 2005 land use. For example, population density is a significant determinant in almost all regions. Terrain slope is a key determinant in many regions, including North America, Europe and Asia; accessibility in South America, Africa and Australia; and potential yield in the Americas, Europe and North Africa. | |||
The region-specific regression models are used in IMAGE to calculate the suitability of land areas in annual time-steps. As well as the suitability assessment, some additional rules are applied. The suitability of strictly protected areas is substantially reduced, or these areas are regarded as entirely unsuitable based on scenario assumptions. Optionally, a small random factor can be included to account for inherent uncertainty and non-deterministic behaviour of land-use change processes, allowing the emergence of new agricultural patches. Agricultural land is expanded according to the final suitability ranking. Extensive pastures located in areas where the natural vegetation is grassland are assumed to be rather constant over time, and thus do not expand and are only abandoned as a result of climate change. | |||
Land use in IMAGE is modelled using dominant land use types per grid cell on a 5 x 5 minute resolution. In reality, land use is more heterogeneous. For some applications, dominant land use on 5 x 5 minute resolution, or the derived proportional land use on a 30 x 30 minute resolution may be sufficient. However, many applications require higher resolution and additional data, such as studies on biodiversity and agricultural intensification ([[Verburg et al., 2012]]). | |||
CLUMondo | |||
{{DisplayFigureTemplate|Baseline figure AS}} | |||
In cooperation with Wageningen University, the IMAGE team initiated the development of a more detailed land-use model ([[Letourneau et al., 2012]]). This finally resulted in the construction of CLUMondo at the VU University Amsterdam, which is also linked to IMAGE 3.0. CLUMondo includes data on landscape composition and heterogeneity, and land-use intensity ([[Van Asselen and Verburg, 2012]]; [[Van Asselen and Verburg, 2013]]). The model uses land systems, a concept that combines data on land cover (cropland, grassland, forest, built-up area, bare land), livestock density and agricultural intensity. These characteristics are combined in 30 land system classes (see figure). | |||
Logistic regressions between a range of biophysical and socioeconomic indicators, and the land systems are used to determine spatially explicit suitability for these systems. In combination with additional settings on neighbourhood effects, location-specific additions and a set of rules on conversion resistance, CLUMondo uses this suitability to model land system changes (see bottom flowchart). The resulting maps of land systems, with their specific characteristics on land-cover areas, livestock density, and agricultural intensity describe changes in land system dynamics over time, and can be used directly in impact models. | |||
CLUMondo is dynamically linked to IMAGE, and the change in land systems can be used as an additional suitability criterion. Fractions of crops and intensive grasslands from CLUMondo are re-arranged in 30 minutes grid cells to dominant 5 minutes crop cells, which are then given a very high suitability ranking in IMAGE to ensure these cells are converted first. In this way, IMAGE follows the dynamics of CLUMondo in terms of location of new or abandoned agricultural land, and tries to make agricultural areas and agricultural expansion in IMAGE and CLUMondo consistent on a 30 x 30 minutes resolution. | |||
Currently, IMAGE is not using the endogenous intensification calculated by CLUMondo ([[Van Asselen and Verburg, 2013]]) because it is not necessarily consistent and is mostly lower than the intensification calculated by the agro-economic model ([[Agricultural economy and forestry | |||
]]). At a later stage, intensification in IMAGE and CLUMondo could be made consistent via iterations or closer linkages. For similar reasons, grassland dynamics are not taken from CLUMondo but from the [[Livestock|IMAGE livestock]] and [[Agricultural economy and forestry|agro-economic models]]. | |||
}} | }} | ||
Revision as of 14:04, 5 May 2014
Parts of Land-use allocation/Description
| Component is implemented in: |
| Components: |
| Related IMAGE components |
| Projects/Applications |
| Key publications |
| References |