Land-use allocation/Description: Difference between revisions
Jump to navigation
Jump to search
No edit summary |
No edit summary |
||
| Line 31: | Line 31: | ||
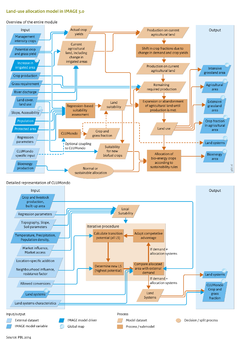
Land use in IMAGE is modelled using dominant land use types per grid cell on a 5 x 5 minute resolution. In reality, land use is more heterogeneous. For some applications, dominant land use on 5 x 5 minute resolution, or the derived proportional land use on a 30 x 30 minute resolution may be sufficient. However, many applications require higher resolution and additional data, such as studies on biodiversity and agricultural intensification ([[Verburg et al., 2012]]). | Land use in IMAGE is modelled using dominant land use types per grid cell on a 5 x 5 minute resolution. In reality, land use is more heterogeneous. For some applications, dominant land use on 5 x 5 minute resolution, or the derived proportional land use on a 30 x 30 minute resolution may be sufficient. However, many applications require higher resolution and additional data, such as studies on biodiversity and agricultural intensification ([[Verburg et al., 2012]]). | ||
CLUMondo | ==CLUMondo== | ||
{{DisplayFigureTemplate|Baseline figure AS}} | {{DisplayFigureTemplate|Baseline figure AS}} | ||
In cooperation with Wageningen University, the IMAGE team initiated the development of a more detailed land-use model ([[Letourneau et al., 2012]]). This finally resulted in the construction of CLUMondo at the VU University Amsterdam, which is also linked to IMAGE 3.0. CLUMondo includes data on landscape composition and heterogeneity, and land-use intensity ([[Van Asselen and Verburg, 2012]]; [[Van Asselen and Verburg, 2013]]). The model uses land systems, a concept that combines data on land cover (cropland, grassland, forest, built-up area, bare land), livestock density and agricultural intensity. These characteristics are combined in 30 land system classes (see figure). | In cooperation with Wageningen University, the IMAGE team initiated the development of a more detailed land-use model ([[Letourneau et al., 2012]]). This finally resulted in the construction of CLUMondo at the VU University Amsterdam, which is also linked to IMAGE 3.0. CLUMondo includes data on landscape composition and heterogeneity, and land-use intensity ([[Van Asselen and Verburg, 2012]]; [[Van Asselen and Verburg, 2013]]). The model uses land systems, a concept that combines data on land cover (cropland, grassland, forest, built-up area, bare land), livestock density and agricultural intensity. These characteristics are combined in 30 land system classes (see figure). | ||
Revision as of 14:04, 5 May 2014
Parts of Land-use allocation/Description
| Component is implemented in: |
| Components: |
| Related IMAGE components |
| Projects/Applications |
| Key publications |
| References |