Land-use allocation/Description: Difference between revisions
Jump to navigation
Jump to search
No edit summary |
m (Text replace - "Agricultural economy and forestry" to "Agricultural economy") |
||
| Line 2: | Line 2: | ||
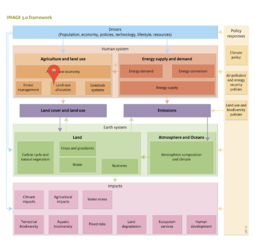
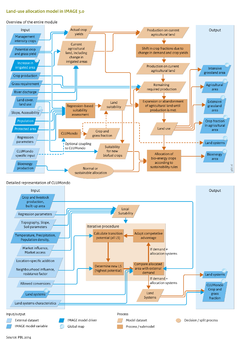
|Description=IMAGE 3.0 has two methods to represent land-use dynamics and to determine the location of new agricultural lands. For applications not focusing on land-use dynamics, a simple regression-based suitability assessment is used to determine future land-use patterns. A dynamic link to CLUMondo ([[Van Asselen and Verburg, 2013]]) enables more detailed representation of land-use systems and their dynamics. Both approaches are embedded in the IMAGE land-use allocation model (see flowchart). | |Description=IMAGE 3.0 has two methods to represent land-use dynamics and to determine the location of new agricultural lands. For applications not focusing on land-use dynamics, a simple regression-based suitability assessment is used to determine future land-use patterns. A dynamic link to CLUMondo ([[Van Asselen and Verburg, 2013]]) enables more detailed representation of land-use systems and their dynamics. Both approaches are embedded in the IMAGE land-use allocation model (see flowchart). | ||
Both approaches are driven by regional crop and grassland production and their respective intensity levels, as calculated by the IMAGE agro-economic model ([[Agricultural economy | Both approaches are driven by regional crop and grassland production and their respective intensity levels, as calculated by the IMAGE agro-economic model ([[Agricultural economy]]). Agricultural land use is allocated to grid cells in an iterative process until the required regional production of crops and grass is met. Land use in IMAGE is modelled using dominant land use per grid cell on a 5 x 5 minute resolution, distinguishing extensive grasslands, agricultural and non-agricultural grid cells, and within agricultural land areas fractions of grass, seven rain-fed and seven irrigated crop types, and bioenergy crops. | ||
In each time step, maps of actual crop yields are computed by combining the potential crop and grassland yields calculated by the crop model ([[Crop and grass]]), and the regional management intensity from the agro-economic model ([[Agricultural economy | In each time step, maps of actual crop yields are computed by combining the potential crop and grassland yields calculated by the crop model ([[Crop and grass]]), and the regional management intensity from the agro-economic model ([[Agricultural economy]]). Starting with the land-cover and land-use map of the previous time step, actual yields are used to determine crop and grassland production on current agricultural land. This is compared to the required regional crop and grassland production. If the demand exceeds calculated production, the agricultural area needs to be expanded at the cost of natural vegetation. If the calculated production of current cropland exceeds the required production, agricultural land is abandoned to adjust to the production required. | ||
Crop and grassland is either abandoned or expanded until the required production is met. Since actual yields are taken into account, changes in crop yields in time due to technological change, climate change and land heterogeneity are included. If yields in the new agricultural areas are lower than average in the current area, relatively more agricultural land is required compared to the production increase. | Crop and grassland is either abandoned or expanded until the required production is met. Since actual yields are taken into account, changes in crop yields in time due to technological change, climate change and land heterogeneity are included. If yields in the new agricultural areas are lower than average in the current area, relatively more agricultural land is required compared to the production increase. | ||
| Line 39: | Line 39: | ||
CLUMondo is dynamically linked to IMAGE, and the change in land systems can be used as an additional suitability criterion. Fractions of crops and intensive grasslands from CLUMondo are re-arranged in 30 minutes grid cells to dominant 5 minutes crop cells, which are then given a very high suitability ranking in IMAGE to ensure these cells are converted first. In this way, IMAGE follows the dynamics of CLUMondo in terms of location of new or abandoned agricultural land, and tries to make agricultural areas and agricultural expansion in IMAGE and CLUMondo consistent on a 30 x 30 minutes resolution. | CLUMondo is dynamically linked to IMAGE, and the change in land systems can be used as an additional suitability criterion. Fractions of crops and intensive grasslands from CLUMondo are re-arranged in 30 minutes grid cells to dominant 5 minutes crop cells, which are then given a very high suitability ranking in IMAGE to ensure these cells are converted first. In this way, IMAGE follows the dynamics of CLUMondo in terms of location of new or abandoned agricultural land, and tries to make agricultural areas and agricultural expansion in IMAGE and CLUMondo consistent on a 30 x 30 minutes resolution. | ||
Currently, IMAGE is not using the endogenous intensification calculated by CLUMondo ([[Van Asselen and Verburg, 2013]]) because it is not necessarily consistent and is mostly lower than the intensification calculated by the agro-economic model ([[Agricultural economy | Currently, IMAGE is not using the endogenous intensification calculated by CLUMondo ([[Van Asselen and Verburg, 2013]]) because it is not necessarily consistent and is mostly lower than the intensification calculated by the agro-economic model ([[Agricultural economy]]). At a later stage, intensification in IMAGE and CLUMondo could be made consistent via iterations or closer linkages. For similar reasons, grassland dynamics are not taken from CLUMondo but from the [[Livestock|IMAGE livestock]] and [[Agricultural economy|agro-economic models]]. | ||
}} | }} | ||
Revision as of 18:28, 16 May 2014
Parts of Land-use allocation/Description
| Component is implemented in: |
| Components: |
| Related IMAGE components |
| Projects/Applications |
| Key publications |
| References |