Land-use allocation/Description: Difference between revisions
Jump to navigation
Jump to search
No edit summary |
No edit summary |
||
| Line 1: | Line 1: | ||
{{ComponentDescriptionTemplate | {{ComponentDescriptionTemplate | ||
|Reference=Van Asselen and Verburg, 2013; Alexandratos and Bruinsma, 2012; Klein Goldewijk et al., 2010; O'Neill, 2013; Lambin et al., 2000; IIASA and FAO, 2012; Nelson, 2008; Klein Goldewijk et al., 2011; Letourneau et al., 2012; Doelman | |Reference=Van Asselen and Verburg, 2013; Alexandratos and Bruinsma, 2012; Klein Goldewijk et al., 2010; O'Neill, 2013; Lambin et al., 2000; IIASA and FAO, 2012; Nelson, 2008; Klein Goldewijk et al., 2011; Letourneau et al., 2012; Doelman et al., in preparation; | ||
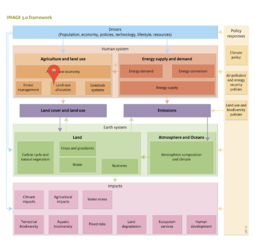
|Description=IMAGE 3.0 | |Description=IMAGE 3.0 uses a regression-based suitability assessment to determine future land-use patterns. Optionally, the IMAGE allocation module can be coupled to CLUMondo ([[Van Asselen and Verburg, 2013]]) [ADD LINK TO ADDITIONAL INFO PAGE] providing a more detailed representation of land-use systems and their dynamics. | ||
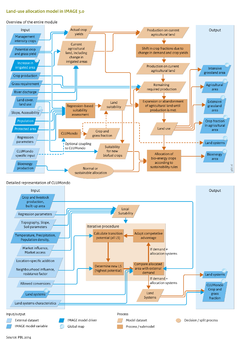
Land-use allocation is driven by regional crop and grassland production and their respective intensity levels, as calculated by the IMAGE agro-economic model ([[Agricultural economy]]). Agricultural land use is allocated to grid cells in an iterative process until the required regional production of crops and grass is met. Land use in IMAGE is modelled using dominant land use per grid cell on a 5 x 5 minute resolution, distinguishing extensive grasslands, agricultural and non-agricultural grid cells, and within agricultural land areas fractions of grass, seven rain-fed and seven irrigated crop types, and bioenergy crops. | |||
In each time step, maps of actual crop yields are computed by combining the potential crop and grassland yields calculated by the crop model ([[Crops and grass]]), and the regional management intensity from the agro-economic model ([[Agricultural economy]]). Starting with the land-cover and land-use map of the previous time step, actual yields are used to determine crop and grassland production on current agricultural land. This is compared to the required regional crop and grassland production. If the demand exceeds calculated production, the agricultural area needs to be expanded at the cost of natural vegetation. If the calculated production of current cropland exceeds the required production, agricultural land is abandoned to adjust to the production required. | In each time step, maps of actual crop yields are computed by combining the potential crop and grassland yields calculated by the crop model ([[Crops and grass]]), and the regional management intensity from the agro-economic model ([[Agricultural economy]]). Starting with the land-cover and land-use map of the previous time step, actual yields are used to determine crop and grassland production on current agricultural land. This is compared to the required regional crop and grassland production. If the demand exceeds calculated production, the agricultural area needs to be expanded at the cost of natural vegetation. If the calculated production of current cropland exceeds the required production, agricultural land is abandoned to adjust to the production required. | ||
| Line 11: | Line 11: | ||
In determining the location of agricultural expansion or abandonment, all grid cells are assessed and ranked on suitability, based on an empirical regression analysis, and optionally based on a link to [[CLUMondo model|CLUMondo]] (see further below). | In determining the location of agricultural expansion or abandonment, all grid cells are assessed and ranked on suitability, based on an empirical regression analysis, and optionally based on a link to [[CLUMondo model|CLUMondo]] (see further below). | ||
Additionally, a few other rules are applied in determining the location of new agricultural land. For instance, agricultural expansion is not permitted in protected areas, and in areas otherwise protected, such as in assumed {{abbrTemplate|REDD}} (reducing emissions from deforestation and degradation) schemes. A grid cell is only regarded suitable for agriculture if the potential rain-fed production is at least | Additionally, a few other rules are applied in determining the location of new agricultural land. For instance, agricultural expansion is not permitted in protected areas, and in areas otherwise protected, such as in assumed {{abbrTemplate|REDD}} (reducing emissions from deforestation and degradation) schemes. A grid cell is only regarded suitable for agriculture if the potential rain-fed production is at least 10% of the global maximum attainable crop yield. Grid cells with a production potential between 0.01 and 10% of the maximum attainable are still assumed suitable for extensive grassland. | ||
Irrigated areas are increased on a regional scale, prescribed by external scenario dependent assumptions, such as based on FAO ([[Alexandratos and Bruinsma, 2012]]). In each time-step, more irrigated areas are allocated in agricultural land based on the need for irrigation (the difference in rain-fed and irrigated yields), and water availability. | Irrigated areas are increased on a regional scale, prescribed by external scenario dependent assumptions, such as based on FAO ([[Alexandratos and Bruinsma, 2012]]). In each time-step, more irrigated areas are allocated in agricultural land based on the need for irrigation (the difference in rain-fed and irrigated yields), and water availability. | ||
| Line 17: | Line 17: | ||
In agricultural areas, the fraction of specific crops is determined based on the initial fractions, and modified annually based on changes in regional demand and local crop yields. As a result, the land-use fraction of a certain crop increases when the demand for this crop increases faster than for other crops, or if the potential yield in this grid cell increases more than for other crops. | In agricultural areas, the fraction of specific crops is determined based on the initial fractions, and modified annually based on changes in regional demand and local crop yields. As a result, the land-use fraction of a certain crop increases when the demand for this crop increases faster than for other crops, or if the potential yield in this grid cell increases more than for other crops. | ||
The land use allocation model enables new land-use and land cover maps to be created ([[Land cover and land use]]). These land-use maps specify agricultural land, extensive grassland, and, land for sustainable bioenergy production. Crop fractions are allocated for all 18 crop types in IMAGE (temperate cereals, rice, maize, tropical cereals, roots and tubers, pulses, and oil crops, both rain-fed and irrigated; grass: and sugar cane, maize for bioenergy and woody and non-woody bioenergy). These data are calculated on a 5 minute resolution, and aggregated to proportional land use on 30 minute resolution of the carbon, crop and water model [[LPJmL model|LPJmL]] | The land use allocation model enables new land-use and land cover maps to be created ([[Land cover and land use]]). These land-use maps specify agricultural land, extensive grassland, and, land for sustainable bioenergy production. Crop fractions are allocated for all 18 crop types in IMAGE (temperate cereals, rice, maize, tropical cereals, roots and tubers, pulses, and oil crops, both rain-fed and irrigated; grass: and sugar cane, maize for bioenergy and woody and non-woody bioenergy). These data are calculated on a 5 minute resolution, and aggregated to proportional land use on 30 minute resolution of the carbon, crop and water model [[LPJmL model|LPJmL]]. | ||
==Empirical regression analysis to determine land use suitability== | ==Empirical regression analysis to determine land use suitability== | ||
Revision as of 15:18, 4 November 2016
Parts of Land-use allocation/Description
| Component is implemented in: |
| Components: |
| Related IMAGE components |
| Projects/Applications |
| Key publications |
| References |