SandBox
Jump to navigation
Jump to search
| HasPageName | HasFigureType | BelongsToComponent | HasAltTitle | HasCaption | |
|---|---|---|---|---|---|
| Baseline figure Agricultural economy | 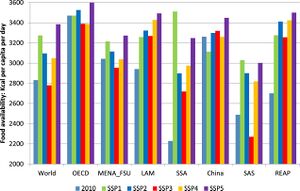 | Baseline figure | Agricultural economy | Global agricultural production and areas per region | Food availability measured in kcal per capita per day available for consumption, for initial situation (2010) and for the SSP scenarios (2100), globally and by region. (van Meijl et al., 2020b) |
| Flowchart Agricultural economy | 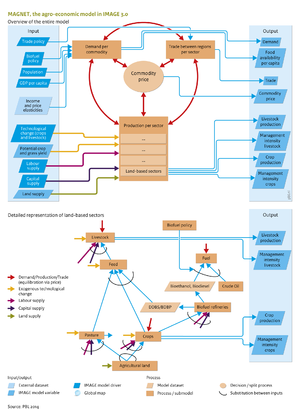 | Flowchart | Agricultural economy | MAGNET- the agro-economic model in IMAGE 3.0 | Flowchart Agricultural economy. See also the Input/Output Table on the introduction page. |
| Icon AEF | Icon | Agricultural economy | Link to framework components overview | Pressure component: Agricultural economy | |
| Policy intervention figure Agricultural economy | 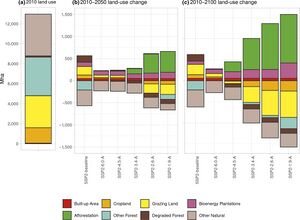 | Policy intervention figure | Agricultural economy | (a) Land use in 2010. Land-use change in (b) 2010–2050 and (c) 2010–2100 for the scenarios with afforestation (Doelman et al., 2020) | |
| Icon ALU | Icon | Agriculture and land use | Link to framework components overview | Main pressure component: Agriculture and land use | |
| Policy intervention figure Land cover and land use | 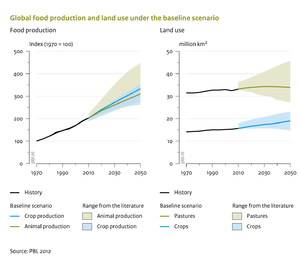 | Policy intervention figure | Agriculture and land use | Global food production and land use under the baseline scenario | Changes in agricultural production and land use |
| Baseline figure Air pollution and energy policies | 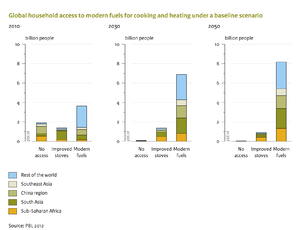 | Baseline figure | Air pollution and energy policies | Global household access to modern fuels for cooking and heating under a baseline scenario | A few key indicators show the trends for energy security, access, air pollution under a baseline scenario. |
| Flowchart Air pollution and energy policies | 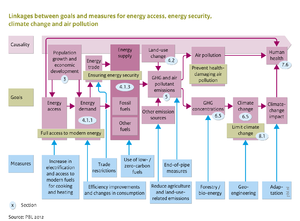 | Flowchart | Air pollution and energy policies | Linkages between goals and measures for energy access, energy security, climate change and air pollution | Flowchart Air pollution and energy policies. Linkages between components of the IMAGE system, energy policy objectives and possible policy measures. |
| Icon APEP | Icon | Air pollution and energy policies | link to framework components overview | Response component: Air pollution and energy policies | |
| Policy intervention figure Air pollution and energy policies | 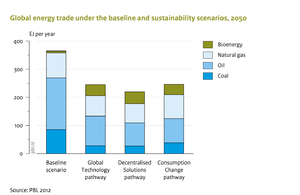 | Policy intervention figure | Air pollution and energy policies | Global energy trade under the baseline and sustainability scenarios, 2050 | Compared to the baseline, energy trade is significantly reduced under the sustainability scenarios (PBL, 2012). |
| Baseline figure Aquatic biodiversity | 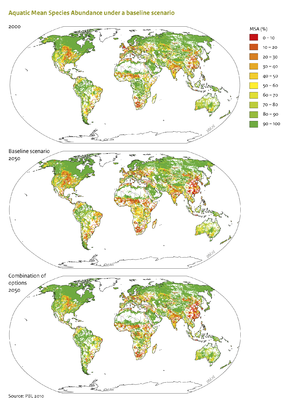 | Baseline figure | Aquatic biodiversity | Aquatic Mean Species Abundance under a baseline scenario | In a baseline scenario, aquatic biodiversity is projected to decrease further. |
| Flowchart Aquatic biodiversity | 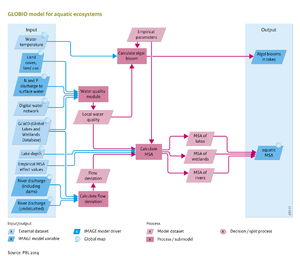 | Flowchart | Aquatic biodiversity | GLOBIO model for aquatic ecosystems | Flowchart Aquatic biodiversity. See also the Input/Output Table on the introduction page. |
| Icon AB | Icon | Aquatic biodiversity | Link to framework components overview | Impact component: Aquatic biodiversity | |
| Policy intervention figure Aquatic biodiversity |  | Policy intervention figure | Aquatic biodiversity | Avoided aquatic biodiversity loss compared to the baseline, under a combination of policy options | A set of ambitious policy options could reduce aquatic biodiversity loss compared to a baseline scenario. |
| Baseline figure Atmospheric composition and climate | 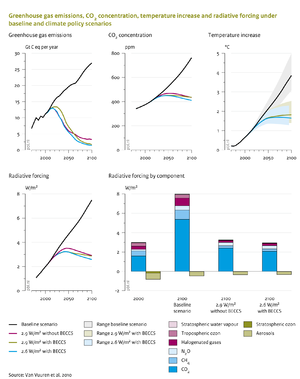 | Baseline figure | Atmospheric composition and climate | Greenhouse gas emissions, CO2 concentration, temperature increase and radiative forcing under baseline and climate policy scenarios | In the policy scenarios, emissions decrease strongly after 2020, while concentration levels only decrease or stabilise after 2050. Global mean temperature, due to inertia in the climate system, will not stabilise until the end of this century under the most ambitious climate policy scenario (2.6 W/m2). |
| Flowchart Atmospheric composition and climate | 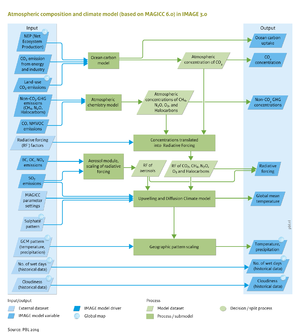 | Flowchart | Atmospheric composition and climate | Atmospheric composition and climate model (based on MAGICC 6.0) in IMAGE 3.0 | Flowchart Atmospheric composition and climate. See also the Input/Output Table on the introduction page. |
| Icon ACC | Icon | Atmospheric composition and climate | Link to framework components overview | State component: Atmospheric composition and climate | |
| Policy intervention figure Atmospheric composition and climate | 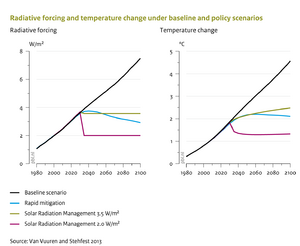 | Policy intervention figure | Atmospheric composition and climate | Radiative forcing and temperature change under baseline and policy scenarios | In addition to ‘conventional’ climate policy, there may be situations where urgent action on climate change is required, either via rapid mitigation, or via Solar Radiation Management (SRM) (e.g. sulphur emissions to the stratosphere). Radiative forcing is immediately stabilised at the intended level by SRM, and also temperatures are adjusted immediately (though not yet at the equilibrium level), and even faster under extreme SRM than would be possible through strong mitigation. However, substantial uncertainties and risks are related to such drastic manipulations of the radiation balance. |
| Baseline figure Carbon cycle and natural vegetation | 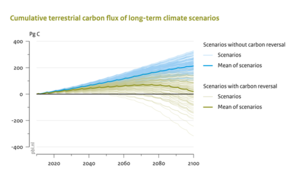 | Baseline figure | Carbon cycle and natural vegetation IMAGE framework summary/Earth system | Cumulative terrestrial carbon flux of long-term climate scenarios | Cumulative terrestrial carbon flux of long-term climate scenarios (Müller et al., 2016) |
| Flowchart Carbon cycle and natural vegetation | 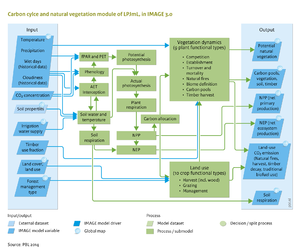 | Flowchart | Carbon cycle and natural vegetation | Carbon cycle and natural vegetation module of LPJmL, in IMAGE 3.0 | Flowchart Carbon cycle and natural vegetation. See also the Input/Output Table on the introduction page. |
| Icon NVCC | Icon | Carbon cycle and natural vegetation | Link to framework components overview | State component: Carbon cycle and natural vegetation | |
| Policy intervention figure Carbon cycle and natural vegetation II | 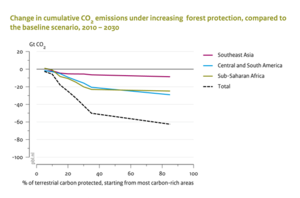 | Policy intervention figure | Carbon cycle and natural vegetation | Change in cumulative CO2 emissions under increasing forest protection, compared to the baseline scenario, 2010-2030 | Increasingly strict REDD regimes might lead to substantial reduction in cumulative terrestrial CO2 emission (Overmars et al., 2014). |
| Icon VHA | Icon | Carbon, vegetation, agriculture and water | link to framework components overview | Main state components: Carbon, vegetation, agriculture and water | |
| Baseline figure Climate policy | 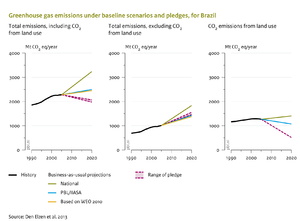 | Baseline figure | Climate policy | Greenhouse gas emissions under baseline scenarios and pledges, for Brazil | The national projection is from the National Decree No. 7390, and the WEO 2010 projection is from the World Energy Outlook (2010) of International Energy Agency. |
| Flowchart Climate policy | 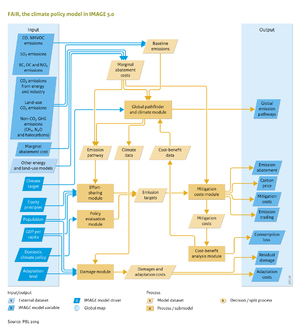 | Flowchart | Climate policy | FAIR, the climate policy model in IMAGE 3.0 | Flowchart Climate policy. See also the Input/Output Table on the introduction page. |
| Icon CP | Icon | Climate policy | Link to framework components overview | Response component: Climate policy | |
| 002g ind16 CP | 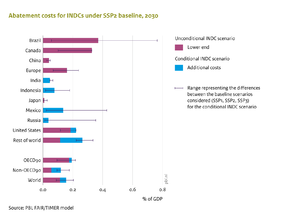 | Policy intervention figure | Climate policy | Regional and global abatement costs for NDCs | |
| Policy intervention figure Climate policy | 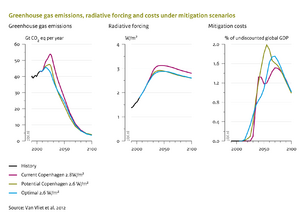 | Policy intervention figure | Climate policy | Greenhouse gas emissions, radiative forcing and costs under mitigation scenarios | Scenario results describing emission pathways representing optimal and delayed policy action (Copenhagen pledges) in 2020, in terms of CO2 emission (including land use), associated radiative forcing (including all gases and aerosol forcing), and global mitigation costs (as percentage of GDP). |
| Core model venn diagram | 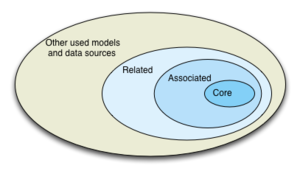 | Other type of figure | Computer models overview | Venn diagram core model | Venn diagram of models used in IMAGE framework |
| Baseline figure Crops and grass | 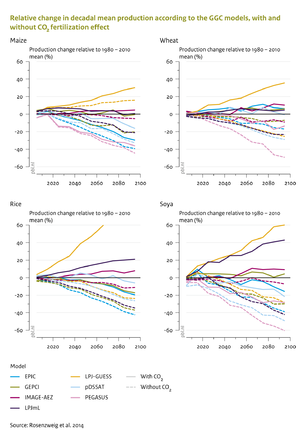 | Baseline figure | Crops and grass | Relative change in decadal mean production according to the GGC models, with and without CO2 fertilization effect | The effect of climate change on crop yields strongly depends on the effect of CO2 fertilisation, also represented in LPJmL. Lines show means across several climate scenarios; adopted from Rosenzweig et al. (2014). |
| Flowchart Crops and grass | 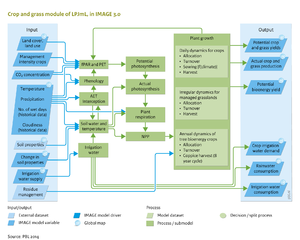 | Flowchart | Crops and grass | Crop and grass module of LPJmL, in IMAGE 3.0 | Flowchart Crops and grass. See also the Input/Output Table on the introduction page. |
| Icon CG | Icon | Crops and grass | Link to framework components overview | State component: Crops and grass | |
| Policy intervention figure Crops and grass | 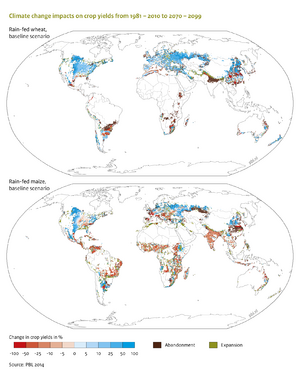 | Policy intervention figure | Crops and grass | Climate change impacts on crop yields from 1981 - 2010 to 2070 - 2099 | By the end of the century climate change impacts on crop yields under the baseline could be reduced by stringent climate policy. |
| USS-Overview | 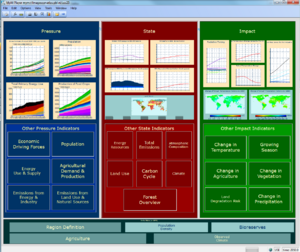 | Other type of figure | Download | USS overview | USS overview |
| Baseline figure Drivers | 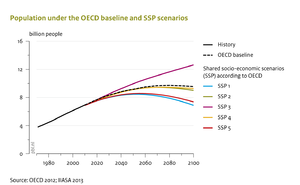 | Baseline figure | Drivers | Population under the OECD baseline and SSP scenarios | The total global population is projected to peak and then decline in the coming century, except under the high-end assumptions (SSP3). By 2100, the population may range between the current and twice as many as in 2000 in the SSPs. The OECD Outlook assumes an intermediate population growth trajectory, close to the medium population SSP scenarios. |
| Flowchart Drivers | 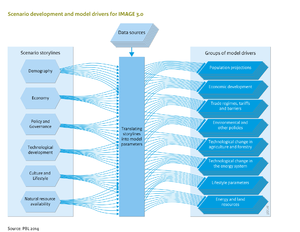 | Flowchart | Drivers | Scenario development and model drivers for IMAGE 3.0 | Flowchart Drivers. Model drives are inferred from scenario storylines taking into account external data sources, such as time series, cross-sector data, and literature sources. |
| Icon D | Icon | Drivers | Link to framework components overview | Driver component: Driver | |
| Policy intervention figure Drivers | 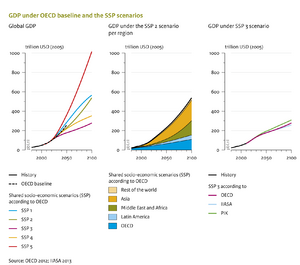 | Policy intervention figure | Drivers | GDP under OECD baseline and the SSP scenarios | Projected total world GDP in the OECD environmental outlook (OECD, 2012) and in the SSP scenarios according to OECD (left), per world region in SSP2 according to OECD (middle) and according to different sources for SSP3 (right). GDP (Gross Domestic Product) is shown in purchasing power parity (ppp), SSP data from the SSP database (IIASA, 2013). |
| Baseline figure Ecosystem services | 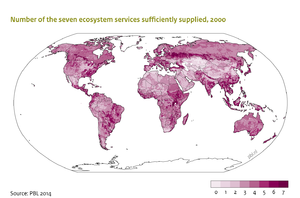 | Baseline figure | Ecosystem services | Numder of the seven ecosystem services sufficiently suppled, 2000 | Assessing how many of the 7 ecosystem services addressed in IMAGE (food, water, Carbon sequestration, erosion protection, pollination, pest control, flood protection, tourism) can be sufficiently supplied allows to identify hotspots of losses in ecosystem services. |
| Flowchart Ecosystem services | 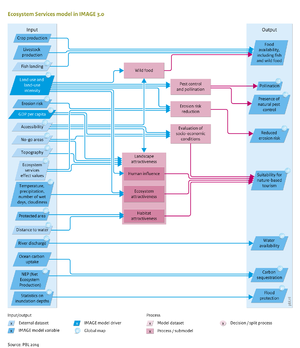 | Flowchart | Ecosystem services | Ecosystem Services model in IMAGE 3.0 | Flowchart Ecosystem services. See also the Input/Output Table on the introduction page. |
| Icon EGS | Icon | Ecosystem services | Link to framework components overview | Impact component: Ecosystem services | |
| Policy intervention figure Ecosystem services | 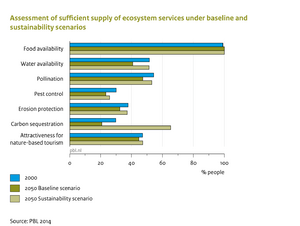 | Policy intervention figure | Ecosystem services | Assessment of sufficient supply of ecosystem services under the baseline and sustainability scenarios | While the supply of ecosystem services is decreasing under a baseline scenario, much of this decline could be avoided under a sustainability scenario (all based on PBL, 2012). |
| Baseline figure Emissions | 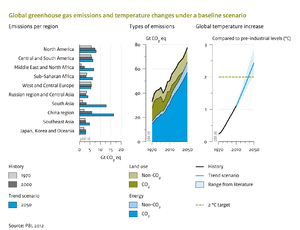 | Baseline figure | Emissions | Gloval greenhouse gas emissions and temperature changes under a baseline scenario | Future greenhouse gas emissions are mostly driven by an increase in energy use, while the relative contribution of land-use related emissions is projected to decrease. |
| Flowchart Emissions | 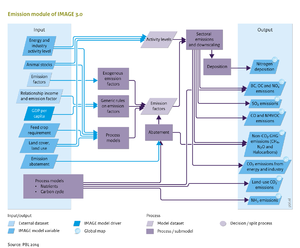 | Flowchart | Emissions | Emission module of IMAGE 3.0 | Flowchart Emissions. See also the Input/Output Table on the introduction page. Anthropogenic sources, for natural sources see Table 5.2.2. More detail on inputs and outputs, and how they link to other IMAGE components is presented at the end of this section (Emission table). |
| Icon E | Icon | Emissions | Link to framework components overview | Pressure component: Emissions | |
| Formula1 Emissions | Other type of figure | Emissions | Formula 1: Emission factor | Formula 1. | |
| Policy intervention figure Emissions | 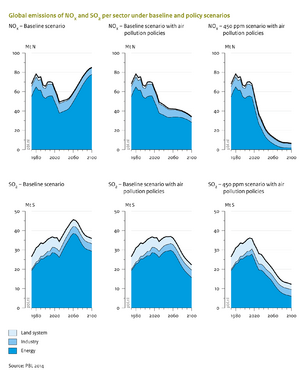 | Policy intervention figure | Emissions | Global emission of NOx and SO2 per sector under baseline and policy scenarios | Climate policy has important co-benefits for air pollution. |
| Baseline figure Energy conversion | 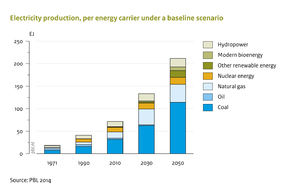 | Baseline figure | Energy conversion | Electricity production, per energy carrier under a baseline scenario | Increase in primary energy demand for electricity production is dominated by coal, despite a rapid growth of renewable energy. |
| Flowchart Energy conversion | 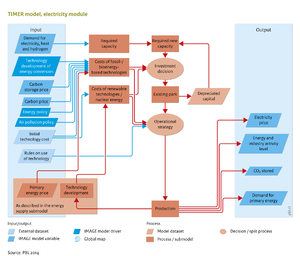 | Flowchart | Energy conversion | TIMER model, electricity module | Flowchart Energy conversion. See also the Input/Output Table on the introduction page. |
| Icon EC | Icon | Energy conversion | Link to framework components overview | Pressure component: Energy conversion | |
| Policy intervention figure Energy conversion | 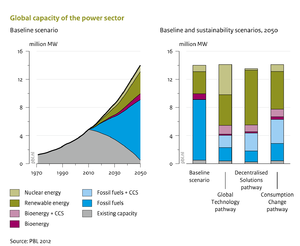 | Policy intervention figure | Energy conversion | Global capacity of the power sector | The large share of conventional coal power in the baseline is replaced by fossil power with CCS and renewable capacity in the sustainability scenarios. |
| Baseline figure Energy demand | 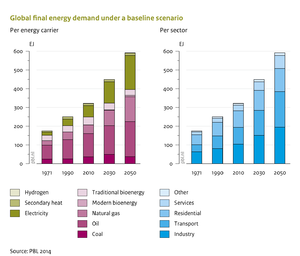 | Baseline figure | Energy demand | Global final energy demand under a baseline scenario | Between 2010 and 2050 energy demand for transport and industry, and for natural gas and electricity contribute most to the overall increase. |
| Flowchart Energy demand | 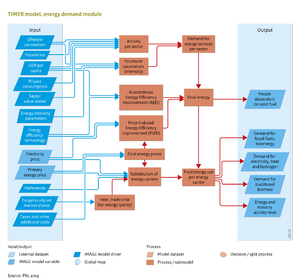 | Flowchart | Energy demand | TIMER model, energy demand module | Some sectors are represented in a generic way as shown here, the sectors transport, residential and heavy industry are modelled in specific modules. |
| Icon ED | Icon | Energy demand | Link to framework components overview | Pressure component: Energy demand | |
| Formula1 Energy demand | Other type of figure | Energy demand | Formula 1: Final energy demand | Formula 1. | |
| Formula2 Energy demand | Other type of figure | Energy demand | Formula 2: Indicated market share | Formula 2. | |
| Policy intervention figure Energy demand | 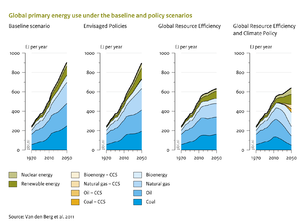 | Policy intervention figure | Energy demand | Global primary energy use under baseline and policy scenarios | The ‘envisaged policies’ scenario includes currently planned policies, the ‘global resource efficiency’ scenario assumes ambitious energy efficiency policies, and the ‘global resource efficiency and climate policy’ scenario additionally assumes policies to meet the 2 °C target. Total primary energy use could be significantly reduced by policies on energy efficiency, whereas additional climate policy would mostly affect the type of resources used. (Van den Berg et al., 2011b) |
| Baseline figure Energy supply | 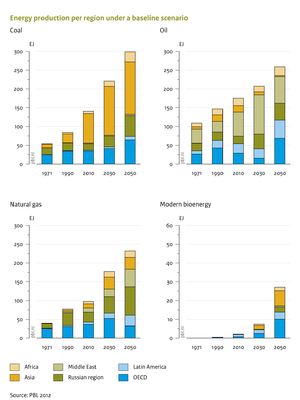 | Baseline figure | Energy supply | Energy production per region under a baseline scenario | Over time the share of most important energy producers for different forms of energy changes. This has implications for energy security. |
| Flowchart Energy supply | 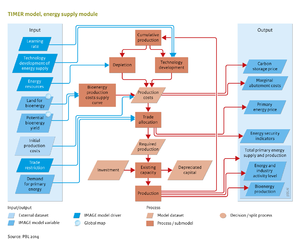 | Flowchart | Energy supply | TIMER model, energy supply module | Flowchart Energy supply. See also the Input/Output Table on the introduction page. |
| Icon ES | Icon | Energy supply | Link to framework components overview | Pressure component: Energy supply | |
| Policy intervention figure Energy supply | 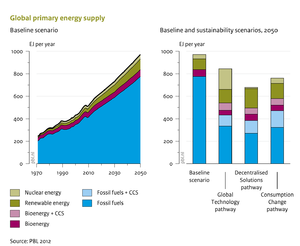 | Policy intervention figure | Energy supply | Global primary energy supply | |
| Flowchart Energy supply and demand | 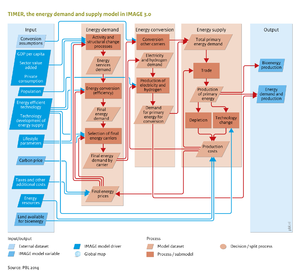 | Flowchart | Energy supply and demand | TIMER, the energy demand and supply model in IMAGE 3.0 | Flowchart Energy supply and demand. Overview of the IMAGE/TIMER model |
| Icon ESD | Icon | Energy supply and demand | Link to framework components overview | Main pressure component: Energy supply and demand | |
| Figure2 IMAGE framework summary | 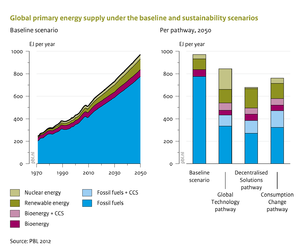 | Other type of figure | Energy supply and demand | Global primary energy supply in baseline and sustainability scenarios | Trends in world energy use, with and without climate policy. |
| Baseline figure Flood risks | 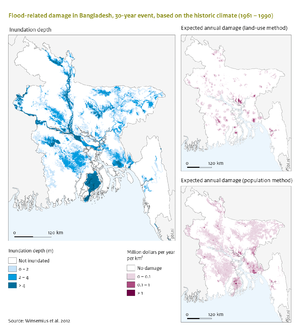 | Baseline figure | Flood risks | Flood-related damage in Bangladesh, 30-year event, based on the historic climate (1961-1990) | Inundation depth of 30-year flood scaled down to Bangladesh (left); The estimated annual damage due to floods (not only due to a 30-year event) is more concentrated when applying the land-use method compared to the population method. |
| Flowchart Flood risks | 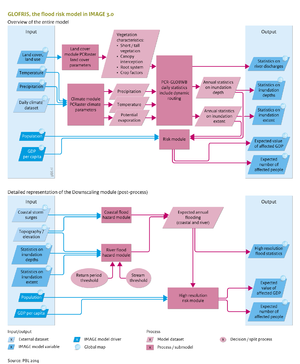 | Flowchart | Flood risks | GLOFRIS, the flood risk model in IMAGE 3.0 | Flowchart Flood risks. See also the Input/Output Table on the introduction page. |
| Icon FR | Icon | Flood risks | link to framework components overview | Impact component: Flood risks | |
| Policy intervention figure Flood risks | 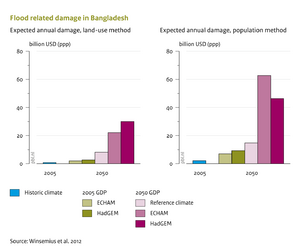 | Policy intervention figure | Flood risks | Flood related damage in Bangladesh | Future expected annual damage due to flooding depends on future climate change, but much even more on future GDP and population distribution. |
| Baseline figure Forest management | 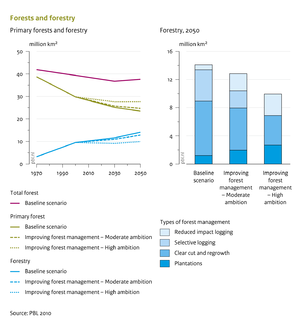 | Baseline figure | Forest management | Forest and forestry | Areas of managed forest are projected to increase in the coming decades; improved forest management, especially forest plantations, could limit the area required for wood production. |
| Flowchart Forest management | 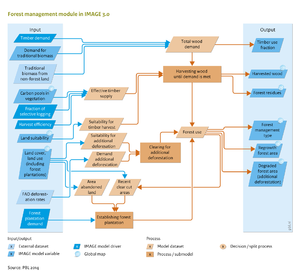 | Flowchart | Forest management | Forest management module in IMAGE 3.0 | Flowchart Forest management. See also the Input/Output Table on the introduction page. The option of forest plantations in IMAGE and LPJmL is still under development, and expected to be available soon. |
| Icon FM | Icon | Forest management | Link to framework components overview | Pressure component: Forest management | |
| Policy intervention figure Forest management | 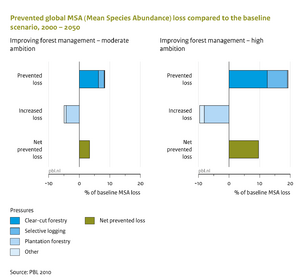 | Policy intervention figure | Forest management | Prevented global MSA (Mean Species Abundance) loss compared to the baseline scenario, 2000 - 2050 | Improved forest management can contribute to reducing biodiversity loss (measured in MSA, see Component Terrestrial biodiversity ). |
| IMAGE framework schematic | 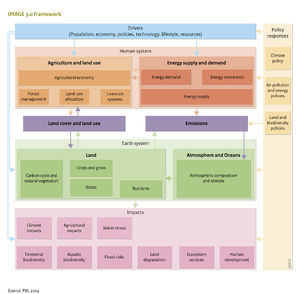 | Flowchart | Framework overview | An overview of the IMAGE framework | An overview of the IMAGE framework and its components |
| Baseline figure Human development | 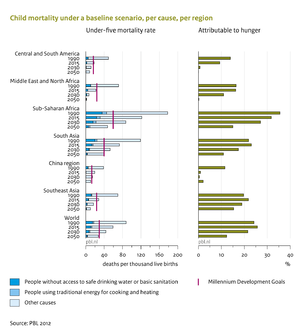 | Baseline figure | Human development | Child mortality under a baseline scenario, per cause, per region | Under a baseline scenario, the global under-five mortality rates will only reach the level of the Millenium Development goals by 2050. |
| Flowchart Human development | 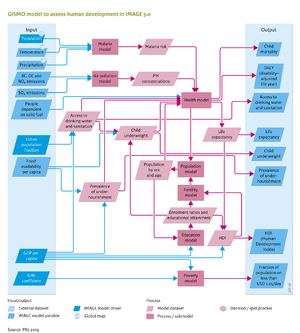 | Flowchart | Human development | GISMO model to assess human development in IMAGE 3.0 | Flowchart Human development. See also the Input/Output Table on the introduction page. |
| Icon HD | Icon | Human development | link to framework components overview | Impact component: Human development | |
| Policy intervention figure Human development | 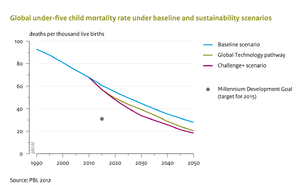 | Policy intervention figure | Human development | Global under-five mortality rate under baseline and sustainability scenarios | Compared to the baseline, the sustainability scenarios ‘Global Technology’ and ‘Challenge +’ (PBL, 2012) will reduce child mortality, but the MDG target set for 2015 would still only be met after 2030. |
| Icon IF | Icon | IMAGE framework summary IMAGE framework | |||
| Baseline figure Water II | 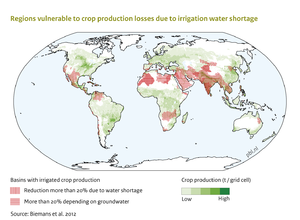 | Baseline figure | IMAGE framework summary/Earth system | Regions vulnerable to crop production losses due to irrigation water shortage | Regions vulnerable to crop production losses due to shortages in irrigation water (Biemans, 2012). |
| Icon I | Icon | Impacts | link to framework components overview | Main impact component: Impact | |
| Flowchart Land and biodiversity policies (A) | 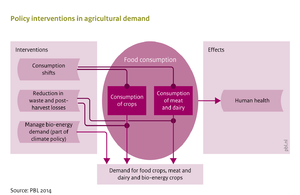 | Flowchart | Land and biodiversity policies | Policy interventions in agricultural demand | Flowchart Land and biodiversity policies (A). Policy interventions in the agricultural demand system. |
| Flowchart Land and biodiversity policies (B) | 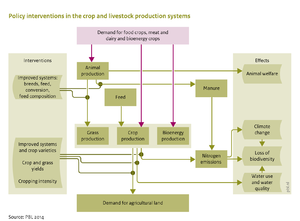 | Flowchart | Land and biodiversity policies | Policy interventions in the crop and livestock production systems | Flowchart Land and biodiversity policies (B). Policy interventions in crop and livestock production systems. |
| Flowchart Land and biodiversity policies (C) | 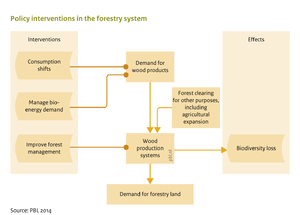 | Flowchart | Land and biodiversity policies | Policy interventions in the forestry system | Flowchart Land and biodiversity policies (C). Policy interventions targeting the forestry sector. |
| Flowchart Land and biodiversity policies (D) | 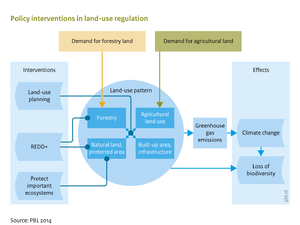 | Flowchart | Land and biodiversity policies | Policy interventions in land-use regulation | Flowchart Land and biodiversity policies (D). Policy interventions that regulate land use and land supply. |
| Icon LBP | Icon | Land and biodiversity policies | link to framework components overview | Response component: Land and biodiversity policies | |
| Policy intervention figure Land and biodiversity policies | 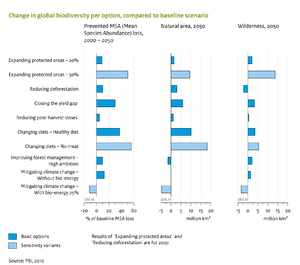 | Policy intervention figure | Land and biodiversity policies | Change in global biodiversity per option, compared to baseline scenario | Results of several interventions in declining biodiversity loss (PBL, 2010) |
| Policy intervention figure Land and biodiversity policies II | 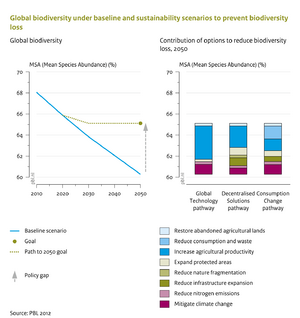 | Policy intervention figure | Land and biodiversity policies | Global biodiversity under baseline and sustainability scenarios to prevent biodiversity loss | Biodiversity is projected to decline further in the baseline scenario (left). Various measures in the demand system, the production system and in land-use regulation contribute to reducing biodiversity loss in the sustainability scenarios (right). |
| Icon LCU | Icon | Land cover and land use | link to framework components overview | State component: Land cover and land use | |
| Baseline figure Land degradation | 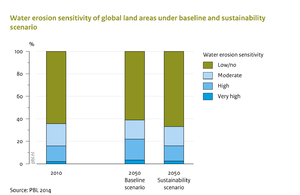 | Baseline figure | Land degradation | Water erosion sensitivity of global land areas under baseline and sustainability scenarios | Under baseline conditions, the risk of high and very high water-induced erosion increases strongly up until 2050. Under the sustainability scenario (PBL, 2012), most of the increase under the baseline scenario is avoided by the combined effect of less land conversion and less climatic change. |
| Flowchart Land degradation | 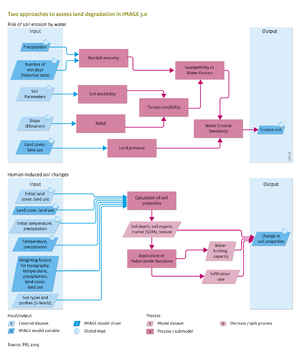 | Flowchart | Land degradation | Two approaches to assess land degradation in IMAGE 3.0 | Flowchart Land degradation. See also the Input/Output Table on the introduction page. |
| Icon LD | Icon | Land degradation | link to framework components overview | Impact component: Land degradation | |
| Formula1 Land degradation | Other type of figure | Land degradation | Land degradation formula 1 | ||
| Formula2 Land degradation |  | Other type of figure | Land degradation | Land degradation formula 2 | |
| Formula3 Land degradation |  | Other type of figure | Land degradation | Land degradation formula 3 | |
| Formula4 Land degradation | Other type of figure | Land degradation | Land degradation formula 3 | ||
| Policy intervention figure Land degradation | 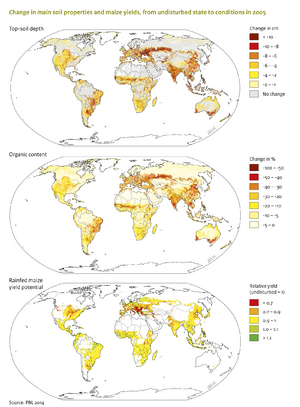 | Policy intervention figure | Land degradation | Changein main soil properties and maize yields, from undisturbed state to conditions in 2005 | As a result of soil degradation and changes in soil properties, yields are up to 30 % lower than they would have been under pristine conditions, in some parts of the world. |
| Baseline figure Land-use allocation | 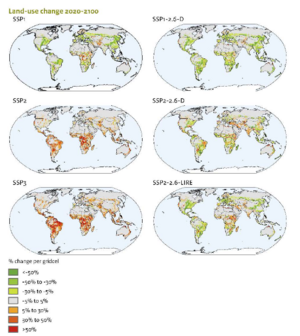 | Baseline figure | Land-use allocation | Distribution of land systems | Natural land conversion in selected SSP scenarios for the 2020-2100 period (van Vuuren et al., 2021) |
| Flowchart Land-use allocation | 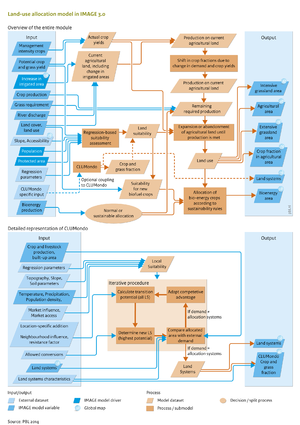 | Flowchart | Land-use allocation | Land-use allocation model in IMAGE 3.0 | Flowchart Land-use allocation. See also the Input/Output Table on the introduction page. |
| Icon AS | Icon | Land-use allocation | link to framework components overview | Pressure component: Land-use allocation | |
| Policy intervention figure Land-use allocation | 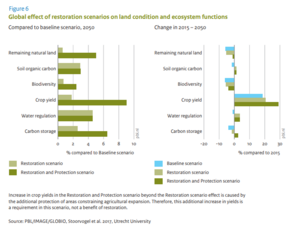 | Policy intervention figure | Land-use allocation | Carbon emissions and land use under restricted land supply, compared to the baseline scenario, 2020 | Impact of land-use change, protection and restoration policies on ecosystem functions (van Esch et al., 2021) |
| ... further results | |||||