Land-use allocation/Data uncertainties limitations: Difference between revisions
Jump to navigation
Jump to search
No edit summary |
Oostenrijr (talk | contribs) No edit summary |
||
| Line 1: | Line 1: | ||
{{ComponentDataUncertaintyAndLimitationsTemplate | {{ComponentDataUncertaintyAndLimitationsTemplate | ||
|Reference=Alexandratos and Bruinsma, 2012; Siebert et al., 2005; UNEP, 2011 | |Reference=Alexandratos and Bruinsma, 2012; Siebert et al., 2005; UNEP, 2011; Hurtt et al., 2011; Nelson, 2008; Hansen et al., 2013; | ||
|Description=<h2>Data, uncertainties and limitations</h2> | |Description=<h2>Data, uncertainties and limitations</h2> | ||
===Data=== | ===Data=== | ||
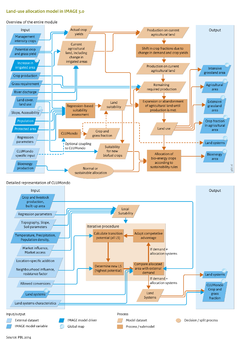
As the starting point for the simulation in 1970, [[HYDE database|HYDE]] land use data were aggregated to dominant land use types on a 5 minute grid scale. For the period 1970–2005, the model can either allocate land use based the dynamic behaviour described above, or be constrained by the HYDE land use map in 2005. The latter option is used mainly when specific impact models require a close match between IMAGE land-use patterns and observations in 2005 ([[Hurtt et al., 2011]]). Other data sources include maps of protected areas ( | As the starting point for the simulation in 1970, [[HYDE database|HYDE]] land use data were aggregated to dominant land use types on a 5 minute grid scale. For the period 1970–2005, the model can either allocate land use based the dynamic behaviour described above, or be constrained by the HYDE land use map in 2005. The latter option is used mainly when specific impact models require a close match between IMAGE land-use patterns and observations in 2005 ([[Hurtt et al., 2011]]). Other data sources include maps of protected areas ([[UNEP, 2011]]), accessibility ([[Nelson, 2008]]), and irrigated areas ([[Siebert et al., 2005]]), all aggregated to the IMAGE 5 minute grid. The trend for future irrigated areas is often based on FAO projections ([[Alexandratos and Bruinsma, 2012]]). | ||
===Uncertainties=== | ===Uncertainties=== | ||
Revision as of 13:48, 1 July 2014
Parts of Land-use allocation/Data uncertainties limitations
| Component is implemented in: |
| Components: |
| Related IMAGE components |
| Projects/Applications |
| Key publications |
| References |