Land-use allocation/Description: Difference between revisions
Jump to navigation
Jump to search
Oostenrijr (talk | contribs) No edit summary |
No edit summary |
||
| Line 1: | Line 1: | ||
{{ComponentDescriptionTemplate | {{ComponentDescriptionTemplate | ||
|Reference=Van Asselen and Verburg, 2013; Alexandratos and Bruinsma, 2012; Klein Goldewijk et al., 2010; O'Neill, 2013; Lambin et al., 2000; IIASA and FAO, 2012; Nelson, 2008; Klein Goldewijk et al., 2011; Letourneau et al., 2012; Doelman and Stehfest, in preparation; | |Reference=Van Asselen and Verburg, 2013; Alexandratos and Bruinsma, 2012; Klein Goldewijk et al., 2010; O'Neill, 2013; Lambin et al., 2000; IIASA and FAO, 2012; Nelson, 2008; Klein Goldewijk et al., 2011; Letourneau et al., 2012; Doelman and Stehfest, in preparation; | ||
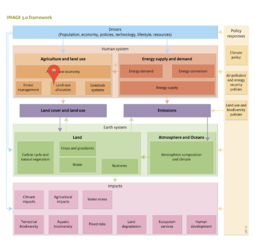
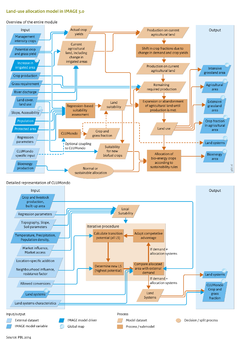
|Description=IMAGE 3.0 has two methods to represent land-use dynamics and to determine the location of new agricultural lands. For applications not focusing on land-use dynamics, a simple regression-based suitability assessment is used to determine future land-use patterns. A dynamic link to CLUMondo ([[Van Asselen and Verburg, 2013]]) enables more detailed representation of land-use systems and their dynamics. Both approaches are embedded in the IMAGE land-use allocation model (see flowchart). | |Description=IMAGE 3.0 has two methods to represent land-use dynamics and to determine the location of new agricultural lands. For applications not focusing on land-use dynamics, a simple regression-based suitability assessment is used to determine future land-use patterns. A dynamic link to CLUMondo ([[Van Asselen and Verburg, 2013]]) enables more detailed representation of land-use systems and their dynamics. Both approaches are embedded in the IMAGE land-use allocation model (see flowchart). | ||
| Line 31: | Line 31: | ||
Land use in IMAGE is modelled using dominant land use types per grid cell on a 5 x 5 minute resolution. In reality, land use is more heterogeneous. For some applications, dominant land use on 5 x 5 minute resolution, or the derived proportional land use on a 30 x 30 minute resolution may be sufficient. However, many applications require higher resolution and additional data, such as studies on biodiversity and agricultural intensification ([[Verburg et al., 2013]]). | Land use in IMAGE is modelled using dominant land use types per grid cell on a 5 x 5 minute resolution. In reality, land use is more heterogeneous. For some applications, dominant land use on 5 x 5 minute resolution, or the derived proportional land use on a 30 x 30 minute resolution may be sufficient. However, many applications require higher resolution and additional data, such as studies on biodiversity and agricultural intensification ([[Verburg et al., 2013]]). | ||
}} | }} | ||
Revision as of 13:33, 4 November 2016
Parts of Land-use allocation/Description
| Component is implemented in: |
| Components: |
| Related IMAGE components |
| Projects/Applications |
| Key publications |
| References |