Semantic search
Jump to navigation
Jump to search
| BelongsToComponent | HasAltTitle | HasCaption | HasFigureType | HasPageName | |
|---|---|---|---|---|---|
| Flowchart Energy supply | Energy supply | TIMER model, energy supply module | Flowchart Energy supply. See also the Input/Output Table on the introduction page. | Flowchart | 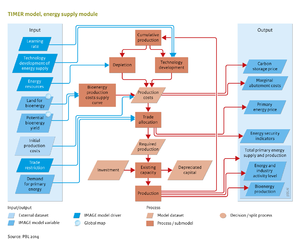 |
| Flowchart Energy supply and demand | Energy supply and demand | TIMER, the energy demand and supply model in IMAGE 3.0 | Flowchart Energy supply and demand. Overview of the IMAGE/TIMER model | Flowchart | 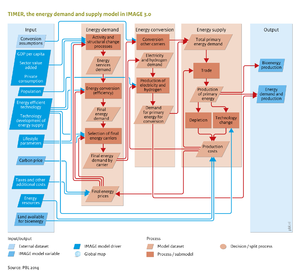 |
| Flowchart Flood risks | Flood risks | GLOFRIS, the flood risk model in IMAGE 3.0 | Flowchart Flood risks. See also the Input/Output Table on the introduction page. | Flowchart | 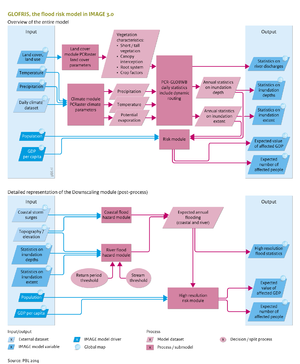 |
| Flowchart Forest management | Forest management | Forest management module in IMAGE 3.0 | Flowchart Forest management. See also the Input/Output Table on the introduction page. The option of forest plantations in IMAGE and LPJmL is still under development, and expected to be available soon. | Flowchart | 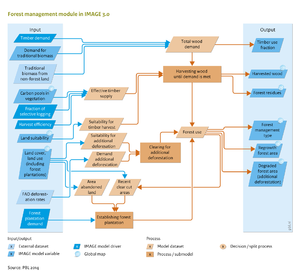 |
| Flowchart Human development | Human development | GISMO model to assess human development in IMAGE 3.0 | Flowchart Human development. See also the Input/Output Table on the introduction page. | Flowchart | 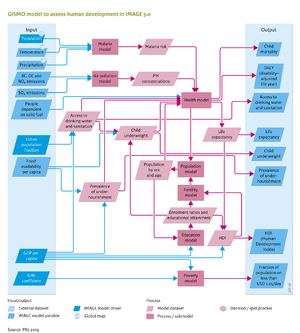 |
| Flowchart Land and biodiversity policies (A) | Land and biodiversity policies | Policy interventions in agricultural demand | Flowchart Land and biodiversity policies (A). Policy interventions in the agricultural demand system. | Flowchart | 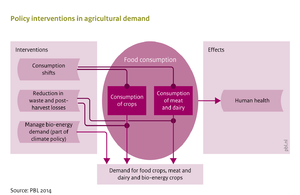 |
| Flowchart Land and biodiversity policies (B) | Land and biodiversity policies | Policy interventions in the crop and livestock production systems | Flowchart Land and biodiversity policies (B). Policy interventions in crop and livestock production systems. | Flowchart | 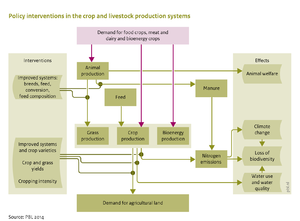 |
| Flowchart Land and biodiversity policies (C) | Land and biodiversity policies | Policy interventions in the forestry system | Flowchart Land and biodiversity policies (C). Policy interventions targeting the forestry sector. | Flowchart | 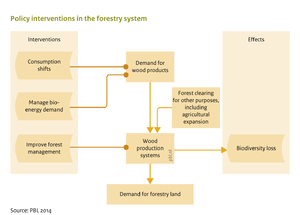 |
| Flowchart Land and biodiversity policies (D) | Land and biodiversity policies | Policy interventions in land-use regulation | Flowchart Land and biodiversity policies (D). Policy interventions that regulate land use and land supply. | Flowchart | 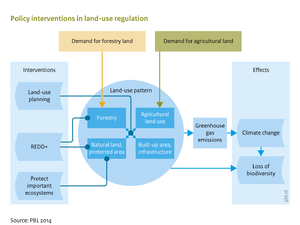 |
| Flowchart Land degradation | Land degradation | Two approaches to assess land degradation in IMAGE 3.0 | Flowchart Land degradation. See also the Input/Output Table on the introduction page. | Flowchart | 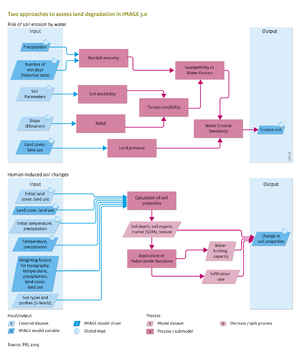 |
| Flowchart Land-use allocation | Land-use allocation | Land-use allocation model in IMAGE 3.0 | Flowchart Land-use allocation. See also the Input/Output Table on the introduction page. | Flowchart | 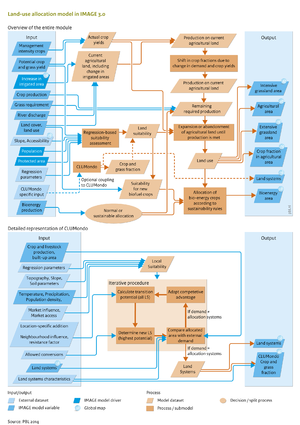 |
| Flowchart Livestock systems | Livestock systems | Livestock systems module in IMAGE 3.0 | Flowchart Livestock systems. See also the Input/Output Table on the introduction page. | Flowchart | 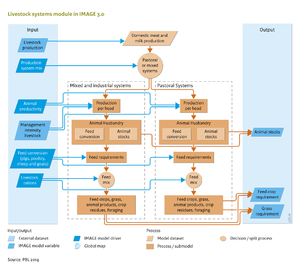 |
| Flowchart Nutrients | Nutrients | Nutrient module of IMAGE 3.0 | Flowchart Nutrients. See also the Input/Output Table on the introduction page. | Flowchart | 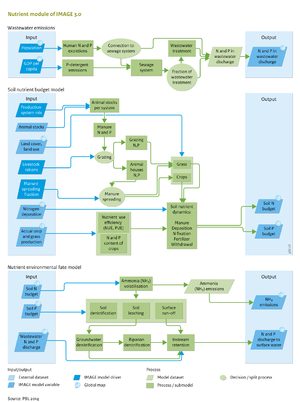 |
| Flowchart Terrestrial biodiversity | Terrestrial biodiversity | GLOBIO model for terrestrial biodiversity in IMAGE 3.0 | Flowchart Terrestrial biodiversity. See also the Input/Output Table on the introduction page. | Flowchart | 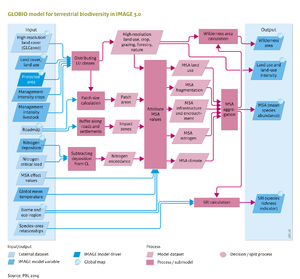 |
| Flowchart Water | Water | Water module of LPJmL, in IMAGE 3.0 | Flowchart Water. See also the Input/Output Table on the introduction page. | Flowchart | 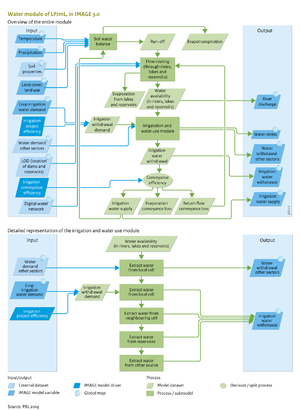 |
| Formula1 Emissions | Emissions | Formula 1: Emission factor | Formula 1. | Other type of figure | |
| Formula1 Energy demand | Energy demand | Formula 1: Final energy demand | Formula 1. | Other type of figure | |
| Formula1 Land degradation | Land degradation | Land degradation formula 1 | Other type of figure | ||
| Formula1 Livestock systems | Livestock systems | Formule1 LS | Formule1 LS | Other type of figure | |
| Formula1 Nutrients | Nutrients | Formula 1: Human nutrient emissions | Formula 1. | Other type of figure | |
| Formula2 Energy demand | Energy demand | Formula 2: Indicated market share | Formula 2. | Other type of figure | |
| Formula2 Land degradation | Land degradation | Land degradation formula 2 | Other type of figure |  | |
| Formula2 Livestock systems | Livestock systems | Formule2 LS | Formula2 | Other type of figure | |
| Formula2 Nutrients | Nutrients | Formula 2: The soil N budget. | Formula 2. | Other type of figure | |
| Formula3 Land degradation | Land degradation | Land degradation formula 3 | Other type of figure |  | |
| Formula4 Land degradation | Land degradation | Land degradation formula 3 | Other type of figure | ||
| Global Anthropogenic CO2 Emissions | Figure Global Anthropogenic CO2 Emissions showing results of 4 scenarios of Rio+20 | Figure showing results of 4 scenarios of Rio+20 | Other type of figure | 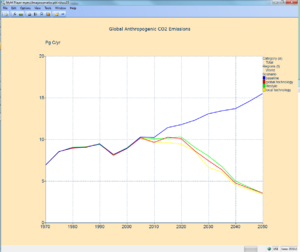 | |
| IMAGE framework schematic | Framework overview | An overview of the IMAGE framework | An overview of the IMAGE framework and its components | Flowchart | 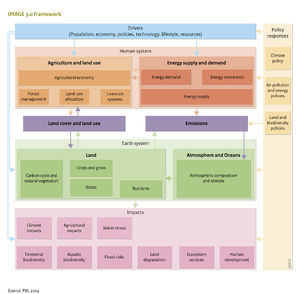 |
| IMAGE framework schematic - DPSIR classification | An overview of the IMAGE framework DPSIR classification | An overview of the IMAGE framework DPSIR classification | Flowchart | 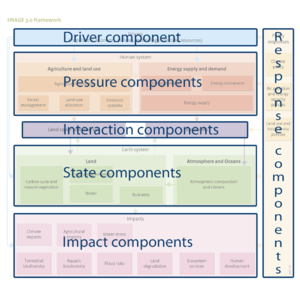 | |
| Icon AB | Aquatic biodiversity | Link to framework components overview | Impact component: Aquatic biodiversity | Icon | |
| Icon ACC | Atmospheric composition and climate | Link to framework components overview | State component: Atmospheric composition and climate | Icon | |
| Icon AEF | Agricultural economy | Link to framework components overview | Pressure component: Agricultural economy | Icon | |
| Icon ALU | Agriculture and land use | Link to framework components overview | Main pressure component: Agriculture and land use | Icon | |
| Icon APEP | Air pollution and energy policies | link to framework components overview | Response component: Air pollution and energy policies | Icon | |
| Icon AS | Land-use allocation | link to framework components overview | Pressure component: Land-use allocation | Icon | |
| Icon CG | Crops and grass | Link to framework components overview | State component: Crops and grass | Icon | |
| Icon CP | Climate policy | Link to framework components overview | Response component: Climate policy | Icon | |
| Icon D | Drivers | Link to framework components overview | Driver component: Driver | Icon | |
| Icon E | Emissions | Link to framework components overview | Pressure component: Emissions | Icon | |
| Icon EC | Energy conversion | Link to framework components overview | Pressure component: Energy conversion | Icon | |
| Icon ED | Energy demand | Link to framework components overview | Pressure component: Energy demand | Icon | |
| Icon EGS | Ecosystem services | Link to framework components overview | Impact component: Ecosystem services | Icon | |
| Icon ES | Energy supply | Link to framework components overview | Pressure component: Energy supply | Icon | |
| Icon ESD | Energy supply and demand | Link to framework components overview | Main pressure component: Energy supply and demand | Icon | |
| Icon FM | Forest management | Link to framework components overview | Pressure component: Forest management | Icon | |
| Icon FR | Flood risks | link to framework components overview | Impact component: Flood risks | Icon | |
| Icon H | Water | link to framework components overview | State component: Water | Icon | |
| Icon HD | Human development | link to framework components overview | Impact component: Human development | Icon | |
| Icon I | Impacts | link to framework components overview | Main impact component: Impact | Icon | |
| Icon IF | IMAGE framework summary IMAGE framework | Icon |