Agricultural economy/Description: Difference between revisions
Jump to navigation
Jump to search
No edit summary |
No edit summary |
||
| Line 21: | Line 21: | ||
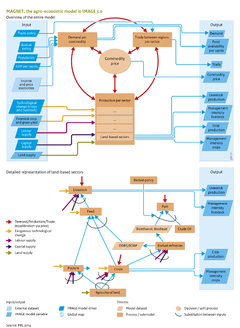
===Land supply in MAGNET=== | ===Land supply in MAGNET=== | ||
In MAGNET, land supply is calculated using a land supply curve that relates the area in use for agriculture to the price of land (Figure 4.1.1.c). Total land supply contains all the land that is potentially available for agriculture, i.e. where crop production is possible given soil and climatic conditions, and where no other restrictions apply (e.g. urban or protected area designations). In the IMAGE model, for every region, total land supply is obtained from potential crop productivity and land availability on a resolution of 5 by 5 arcminutes. Within this total potential, the land supply curve indicates the price at which additional land may be taken in use. The supply curve depends on total land supply, actual agricultural area, the actual land price, and the estimated actual price elasticity of land supply. Regions differ in the fraction of land already in use, and in the change in land prices related to changes in agricultural land use. In regions where most of the area suitable for agriculture is already in use, the price elasticity of land supply is small, with little expansion occurring at strong price changes. In contrast, in regions with a large reserve of suitable agricultural land, such as sub-Saharan Africa and some regions in South America, the price elasticity of land supply is large, i.e. strong expansion of agricultural land occurs at small price changes. | In MAGNET, land supply is calculated using a land supply curve that relates the area in use for agriculture to the price of land ([[Figure 4.1.1.c***]]). Total land supply contains all the land that is potentially available for agriculture, i.e. where crop production is possible given soil and climatic conditions, and where no other restrictions apply (e.g. urban or protected area designations). In the IMAGE model, for every region, total land supply is obtained from potential crop productivity and land availability on a resolution of 5 by 5 arcminutes. Within this total potential, the land supply curve indicates the price at which additional land may be taken in use. The supply curve depends on total land supply, actual agricultural area, the actual land price, and the estimated actual price elasticity of land supply. Regions differ in the fraction of land already in use, and in the change in land prices related to changes in agricultural land use. In regions where most of the area suitable for agriculture is already in use, the price elasticity of land supply is small, with little expansion occurring at strong price changes. In contrast, in regions with a large reserve of suitable agricultural land, such as sub-Saharan Africa and some regions in South America, the price elasticity of land supply is large, i.e. strong expansion of agricultural land occurs at small price changes. | ||
===Reduced availability of land=== | ===Reduced availability of land=== | ||
Revision as of 15:49, 16 December 2013
Parts of Agricultural economy/Description
| Component is implemented in: |
|
| Related IMAGE components |
| Projects/Applications |
| Key publications |
| References |